Data: Version 4 (V4) Release
Improving the accuracy of Aquarius measurements is a key activity to ensure that the data are most useful for science and
society. Scientists and engineers work together continuously to test and refine algorithms, or step-by-step procedures for
calculations, used to process Aquarius' ocean surface salinity data. The result is periodic updates to the data processing,
such as Version 4 (V4).
Working on processing algorithms goes hand-in-hand with calibration and validation (or "Cal/Val"). Calibration
is the process of correlating the instrument readings with a standard to check its accuracy. Validation occurs when the
instrument's accuracy is proven; for Aquarius, this is accomplished using data from computer models and in-water buoys.
Key steps that have been improved in the V4 data release are shown in bold letters in the "Cal/Val Steps" table (at right). Italics show interim values calculated during the Cal/Val process.
This movie features radiometer expert, Dr. Shannon Brown, who summarizes updates to the V4 algorithm since Version 3 (V3) (click the image to start). Complete with graphical information, this 20-minute video highlights key changes associated with V4, content that will be of interest to any user of Aquarius data (video transcript).
 The Aquarius Cal/Val team spent considerable effort to understand the physical origin of this observed bias in salinity
measurements. An important consideration was the observed correlation between regional patterns of Aquarius salinity compared
to Argo floats (upper map at left) and sea surface temperature (lower map at left). Further studies showed that the
bias in salinity was also dependent on wind speed. Together, these clues led the Cal/Val team to investigate three
algorithms within the Aquarius data processing: the dielectric model, oxygen absorption model,
and surface roughness correction model.
The Aquarius Cal/Val team spent considerable effort to understand the physical origin of this observed bias in salinity
measurements. An important consideration was the observed correlation between regional patterns of Aquarius salinity compared
to Argo floats (upper map at left) and sea surface temperature (lower map at left). Further studies showed that the
bias in salinity was also dependent on wind speed. Together, these clues led the Cal/Val team to investigate three
algorithms within the Aquarius data processing: the dielectric model, oxygen absorption model,
and surface roughness correction model.
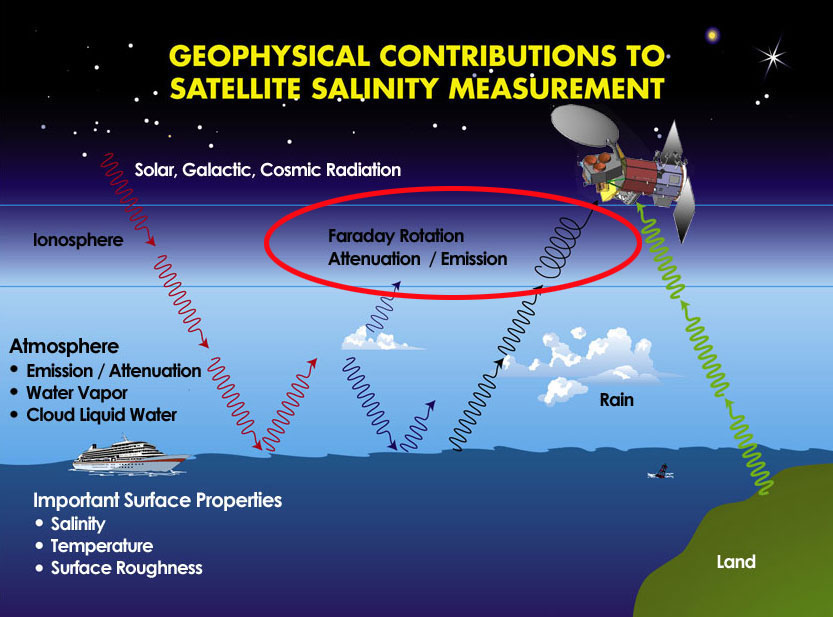
As indicated in the flow diagram at right, Aquarius measured Earth's brightness temperature and converted it to salinity. The dielectric model function relates the amount of brightness temperature to the concentration of dissolved salt in seawater. One processing step is removing atmospheric contributions, which involves the oxygen absorption model correction. Salinity signals – detected by Aquarius as microwave energy emission – originate from the ocean and propagate through Earth's atmosphere. Comprised of about 20% oxygen, the atmosphere absorbs some of this energy and re-emits it based on air temperature. Thus to precisely calculate salinity, a perfectly tuned oxygen absorption model is needed. An even more important processing step is removing "roughness effects" caused by wind and waves on the ocean surface. The surface roughness correction model relates these data collected by the Aquarius scatterometer to brightness temperature. In general, a smoother sea surface has a lower brightness temperature than a wind-roughened ocean.
 Overall, by making corrections to these models' uncertainties – as opposed to making empirical corrections to the salinity
products themselves as was done in V3 – the Aquarius V4 product is now more physically based.
Overall, by making corrections to these models' uncertainties – as opposed to making empirical corrections to the salinity
products themselves as was done in V3 – the Aquarius V4 product is now more physically based.
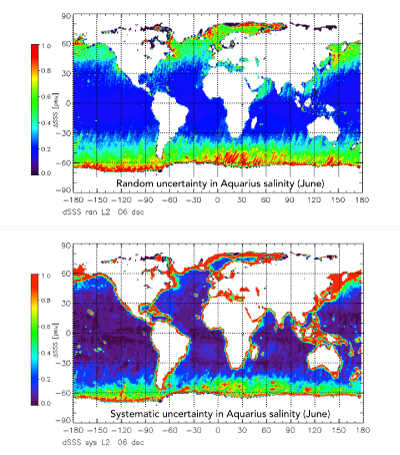
For both random and systematic uncertainties there is a correlation with latitude. This is because the salinity signal – that is how much change in salinity causes a change in brightness temperature – varies with sea surface temperature (see graph). In very warm water, for example in the tropics, the Aquarius radiometer was very sensitive to sea surface salinity. In these warm ocean regions, a small change in salinity produces a much larger change in brightness temperature, which can be detected with much lower uncertainty.
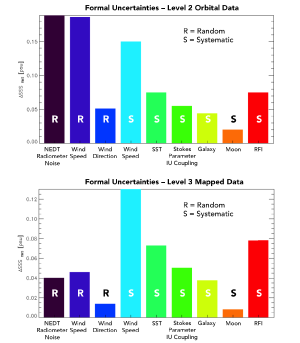 Random uncertainties decrease with data averaging. Thus random uncertainty is higher on Level-2 (orbital) products
than gridded (Level-3) products (see graphs at right). For Aquarius, the major contributors to random uncertainties were
radiometer noise ("NEDT") and wind speed (upper graph at right).
Random uncertainties decrease with data averaging. Thus random uncertainty is higher on Level-2 (orbital) products
than gridded (Level-3) products (see graphs at right). For Aquarius, the major contributors to random uncertainties were
radiometer noise ("NEDT") and wind speed (upper graph at right).
Systematic uncertainties, on the other hand, don't average down. Thus monthly and weekly Level-3 products have much higher systematic than random uncertainties (lower graph at right). Systematic uncertainties can be regionally or temporally dependent. Wind speed, for example, is the largest contribution to the systematic uncertainty budget in V4.
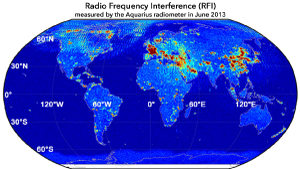 Systematic biases are high near coasts because land is very radiometrically warm compared with the ocean. Thus as the
ocean salinity data collection footprint moved toward the coast, the possibility of land signal "contamination" increased.
Moreover, some land regions have very high uncertainties associated with Radio Frequency Interference (RFI) (see map at left).
RFI is human-derived electromagnetic emission produced by cell phones, walkie talkies, ground-based radars, etc. These
signals interfere with salinity sensors such as Aquarius, which detect at frequencies that are supposed to be protected for
radio astronomy research (1.41 Gigahertz). Given that completely filtering RFI is not possible, the Cal/Val team has
estimated how much is leaking through and included this information in the V4 uncertainty product.
Systematic biases are high near coasts because land is very radiometrically warm compared with the ocean. Thus as the
ocean salinity data collection footprint moved toward the coast, the possibility of land signal "contamination" increased.
Moreover, some land regions have very high uncertainties associated with Radio Frequency Interference (RFI) (see map at left).
RFI is human-derived electromagnetic emission produced by cell phones, walkie talkies, ground-based radars, etc. These
signals interfere with salinity sensors such as Aquarius, which detect at frequencies that are supposed to be protected for
radio astronomy research (1.41 Gigahertz). Given that completely filtering RFI is not possible, the Cal/Val team has
estimated how much is leaking through and included this information in the V4 uncertainty product.
V5 will likely include:
Stay tuned!
| Cal/Val Steps |
|---|
Counts from Each Radiometer |
Calibration of Radiometer Data |
Total Antenna Temperature |
Remove Space Contributions |
Earth Antenna Temperature |
Remove Antenna Pattern Effect |
Earth Brightness Temperature (BT) |
Correct for Faraday Rotation |
Top of Atmosphere BT |
Remove Atmospheric Contribution |
Ocean Surface BT |
Remove Surface Roughness Effects |
Specular BT |
Match to Computer Models & In-Water Data |
Salinity! |
Key steps that have been improved in the V4 data release are shown in bold letters in the "Cal/Val Steps" table (at right). Italics show interim values calculated during the Cal/Val process.
Learn All About It From Shannon Brown!
This movie features radiometer expert, Dr. Shannon Brown, who summarizes updates to the V4 algorithm since Version 3 (V3) (click the image to start). Complete with graphical information, this 20-minute video highlights key changes associated with V4, content that will be of interest to any user of Aquarius data (video transcript).
Elimination of Sea Surface Temperature Bias Adjustment
One of the other major improvements in the V4 product is explicit correction for the sea surface temperature (SST) bias that
was observed in previous versions of Aquarius sea surface salinity data. For Version 3, this bias was handled through an
empirically based evaluation product. For V4, this additional product has been eliminated altogether.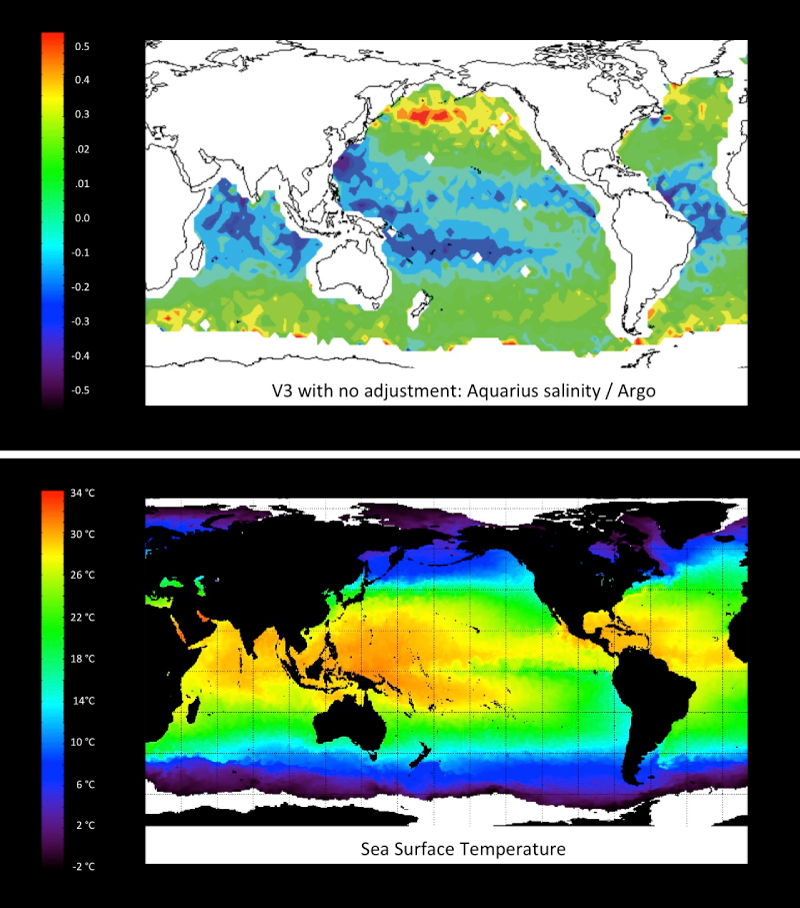
As indicated in the flow diagram at right, Aquarius measured Earth's brightness temperature and converted it to salinity. The dielectric model function relates the amount of brightness temperature to the concentration of dissolved salt in seawater. One processing step is removing atmospheric contributions, which involves the oxygen absorption model correction. Salinity signals – detected by Aquarius as microwave energy emission – originate from the ocean and propagate through Earth's atmosphere. Comprised of about 20% oxygen, the atmosphere absorbs some of this energy and re-emits it based on air temperature. Thus to precisely calculate salinity, a perfectly tuned oxygen absorption model is needed. An even more important processing step is removing "roughness effects" caused by wind and waves on the ocean surface. The surface roughness correction model relates these data collected by the Aquarius scatterometer to brightness temperature. In general, a smoother sea surface has a lower brightness temperature than a wind-roughened ocean.
Addition of Uncertainty Estimates
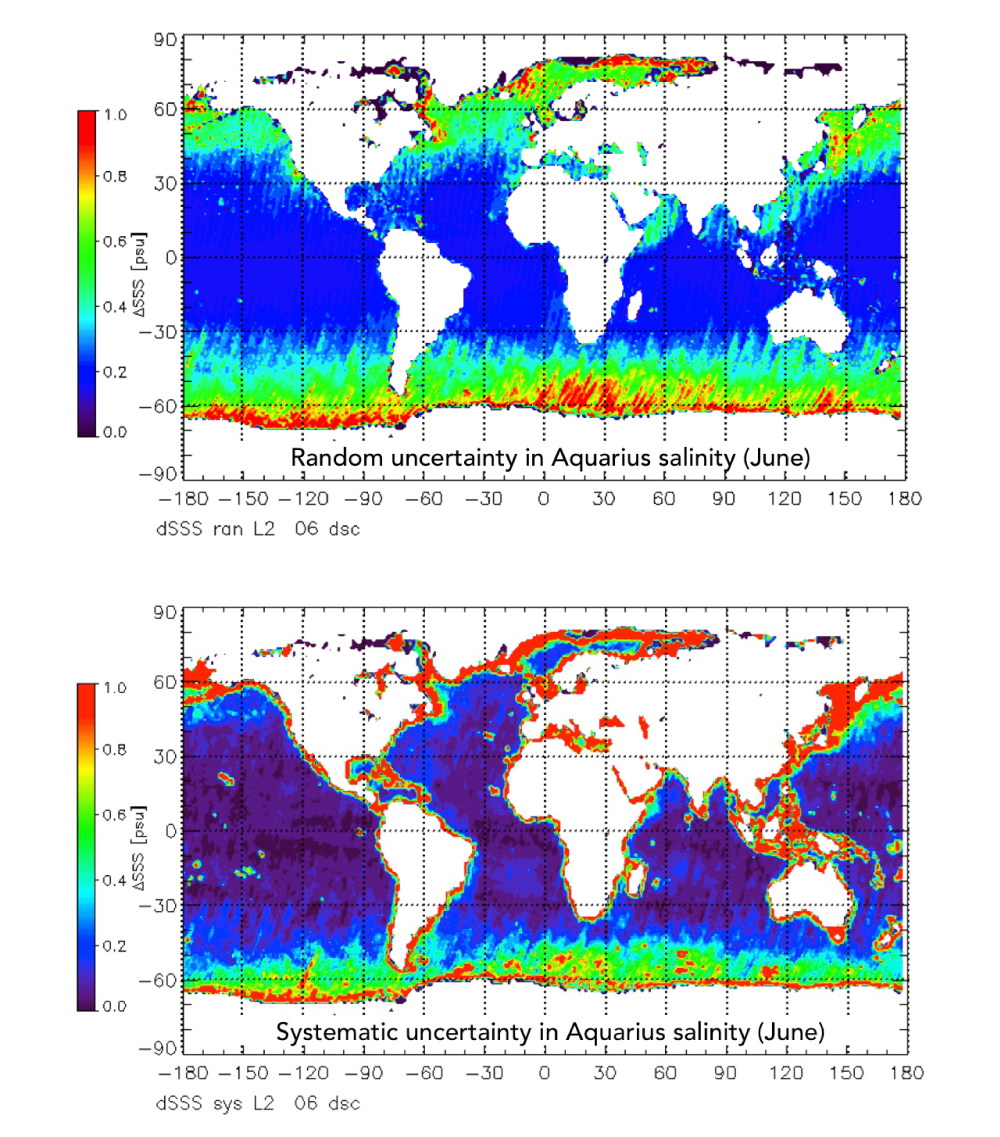
New to V4 is the addition of maps that provide users with estimates of regional uncertainties. The objective of these maps
is to familiarize data users about areas where the Aquarius radiometer retrieved salinity very well (i.e., have
lower uncertainty) and areas where it might have had a little bit more difficulty in doing so (i.e., have higher uncertainty).
The full report (Meissner, 2015), which is available from the PO.DAAC,
has grouped these into random (upper map at right) and systematic (lower map at right) uncertainties.For both random and systematic uncertainties there is a correlation with latitude. This is because the salinity signal – that is how much change in salinity causes a change in brightness temperature – varies with sea surface temperature (see graph). In very warm water, for example in the tropics, the Aquarius radiometer was very sensitive to sea surface salinity. In these warm ocean regions, a small change in salinity produces a much larger change in brightness temperature, which can be detected with much lower uncertainty.

Systematic uncertainties, on the other hand, don't average down. Thus monthly and weekly Level-3 products have much higher systematic than random uncertainties (lower graph at right). Systematic uncertainties can be regionally or temporally dependent. Wind speed, for example, is the largest contribution to the systematic uncertainty budget in V4.

Correction of Antenna Patterns
Although not as significant as the other improvements previously described, a small correction has been made to the
Aquarius antenna pattern in the V4 processing. Salinity data derived from two antenna model patterns – based on a
small-scale physical model and electromagnetic simulation software – were compared with salinity data from in-water
floats (i.e., Argo drifter network) and a computer model
(i.e., HYCOM). The Aquarius Cal/Val team found that the physical scale model produced
the best agreement with the other data sets over land. The electromagnetic simulation software, on the other hand, was
more accurate in terms of providing information about the mixing between vertical and horizontal polarizations of the
Aquarius signal. Confirmed by data collected during Aquarius cold sky calibration maneuvers, V4 includes a new hybrid
antenna pattern correction.New Sea Surface Density Product
V4 includes a new density product, which is derived from Aquarius sea surface salinity and an ancillary SST
(Reynolds Optimally Interpolated). Daily and weekly density maps can be
accessed from the Aquarius Data Gallery. A time-series movie of monthly maps (at left)
shows that areas of colder, saltier water have higher densities (orange colors) while in the tropics – where you have warmer,
less salty water – densities are lower (purple colors). Density data (Level-2 orbital and Level-3 gridded) are available
from the PO.DAAC (see table below right).What's Next in Version 5 (V5)
Measuring sea surface salinity from space is very challenging, which in a sense, means calibration is an on-going process.
For V5, the Aquarius Cal/Val team has a number of calibration improvements planned resulting from continued understanding
of the performance of the radiometer plus fine tuning that is enabled by having almost four years of Aquarius data.V5 will likely include:
- Addressing residual biases
- Further algorithm improvement
- More RFI corrections
- Retrieval of SSS closer to land
Stay tuned!