Education: Activities & Documents
Analyzing Monthly Environmental Data
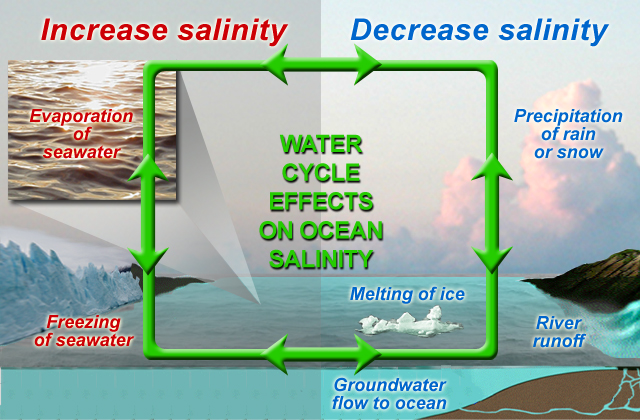
Analyzing sea surface salinity data patterns over time provides insight into variations in the earth's water cycle. This is because some water cycle processes increase salinity while other processes decrease salinity (see map at right).Salinity patterns are governed by geographic differences in the "water budget." For example, like on continents, some areas of the ocean are rainy whereas others are arid and "desert-like." To learn more about the factors that influence salinity patterns, we invite you investigate five pairs of data maps centered over the North Atlantic Ocean (listed below). Each map shows monthly conditions based on long-term averages. The challenge is to find the data set that most closely corresponds to sea surface salinity patterns.
Grade level 5-8: Look at monthly maps of: Are any of these data sets closely correlated with solar energy input (e.g., seasonal change)?
Grade level 9-12: For the North Atlantic Ocean, look at monthly maps of:
- Air Temperature vs. Sea Surface Salinity
- Precipitation vs. Sea Surface Salinity
- Evaporation vs. Sea Surface Salinity
Video: Sea Surface Salinity