Education: Salinity Data Exploration
Exploring salinity patterns is a great way to better understand the relationships between the water cycle, ocean circulation,
and climate. Our data tools can be used to explore Aquarius Ocean Surface Salinity and Historical Ocean Data
(salinity, temperature and density at the ocean surface and below).
Ocean surface salinity data from Aquarius are available by year, season, and month in two formats: 3D (GoogleEarth globe) and 2D (flat maps). Monthly data are presented as both means (i.e., data averaged over the month) and anomalies (i.e., differences from the annual average of Aquarius data). Animations of monthly means and anomalies are also available (2D format only).
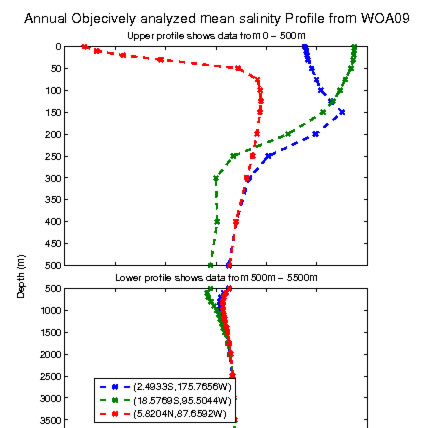
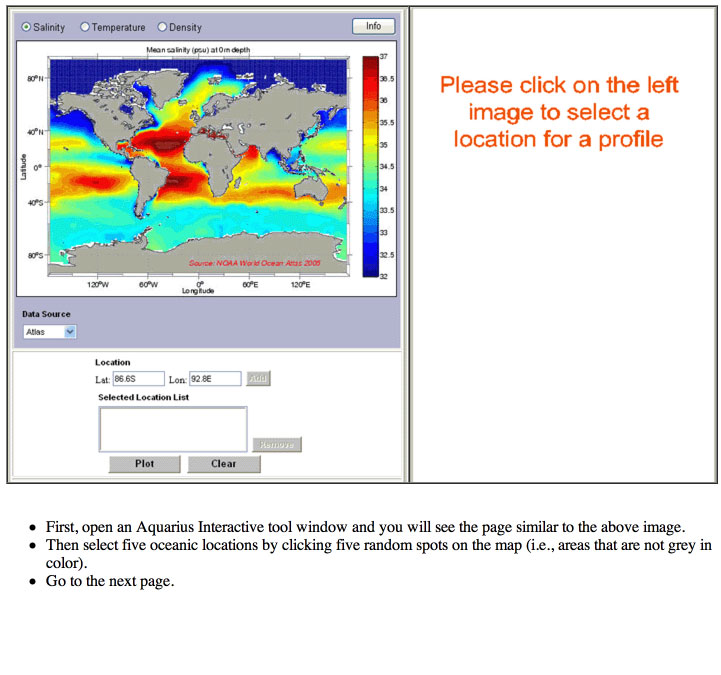
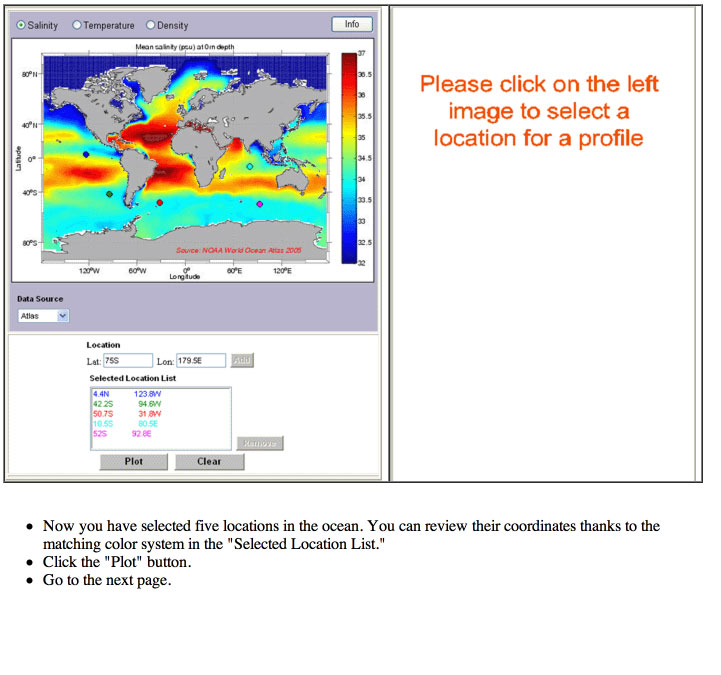
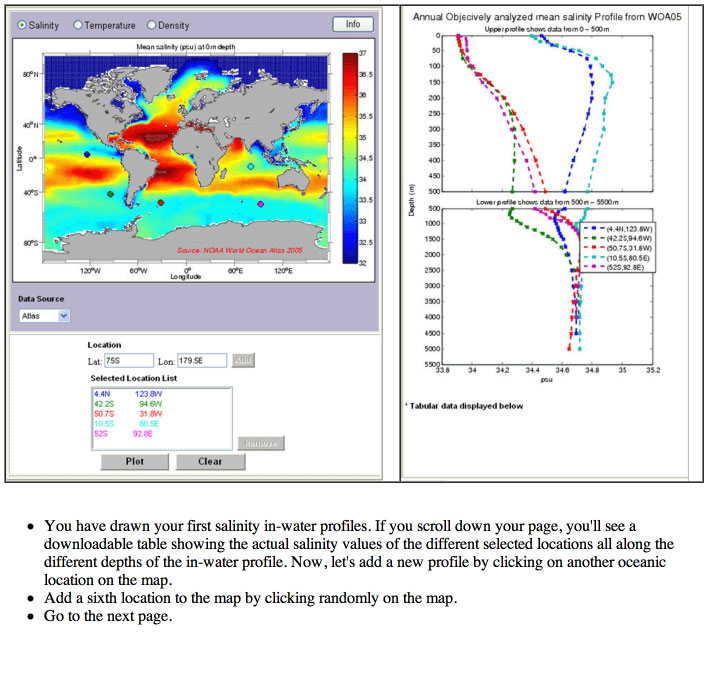
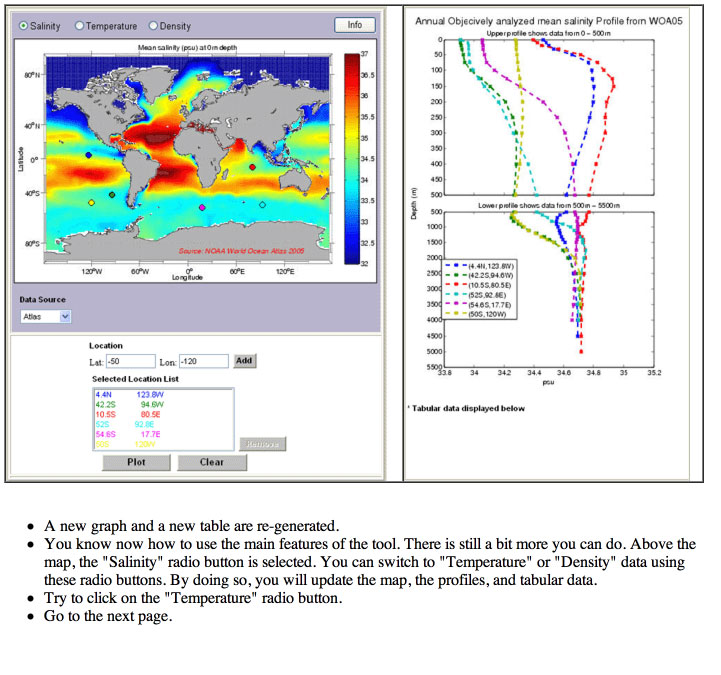
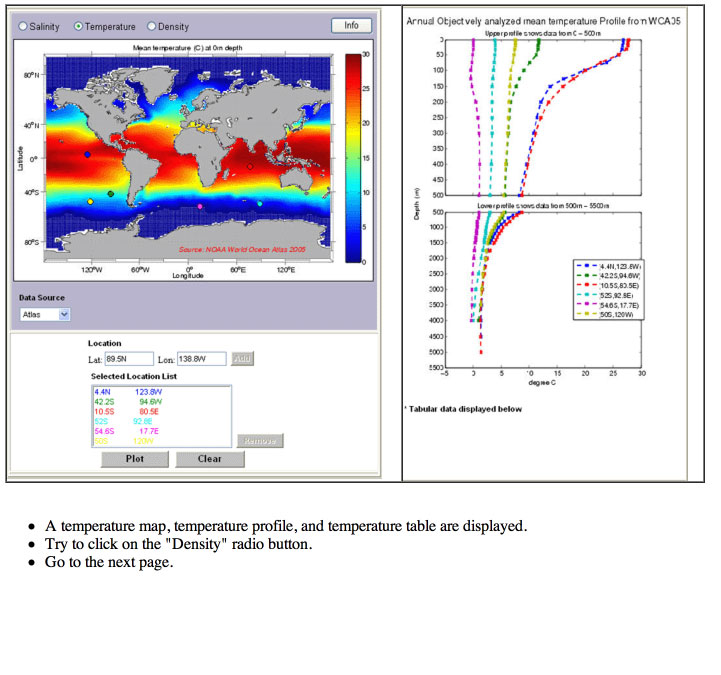
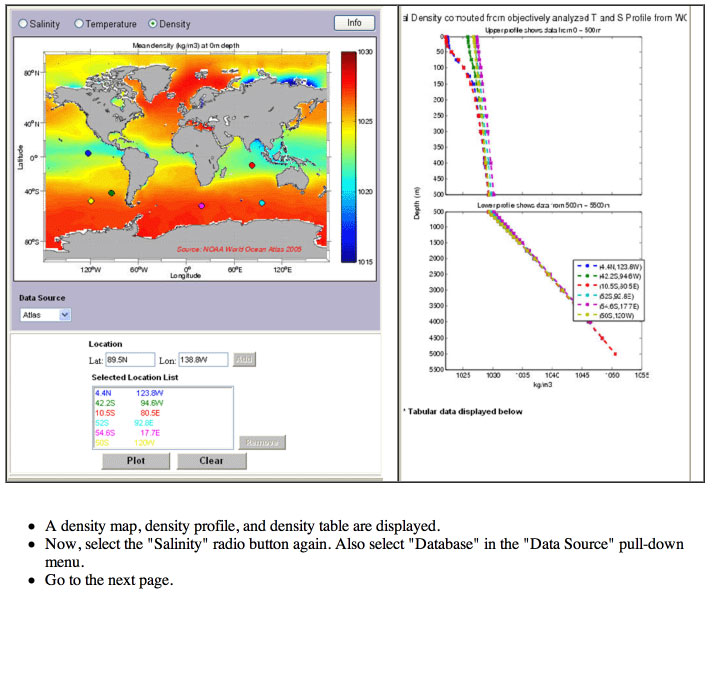
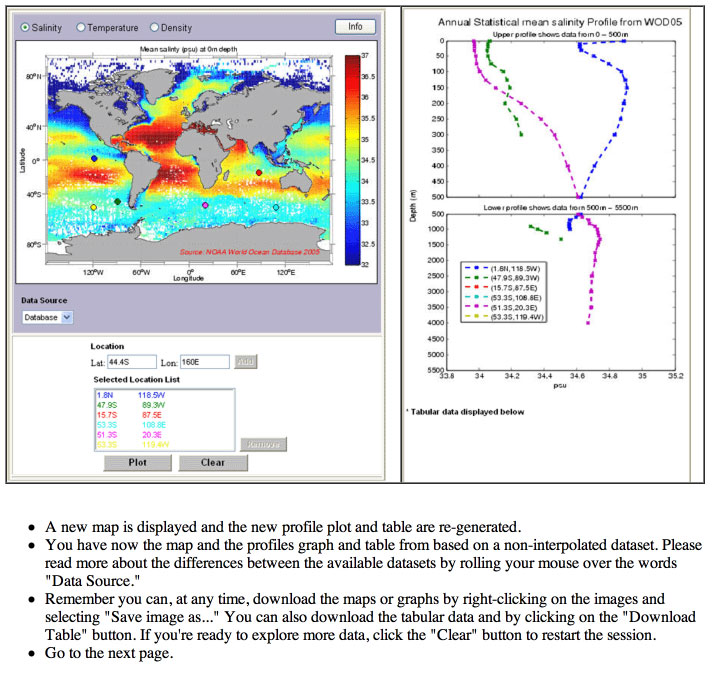
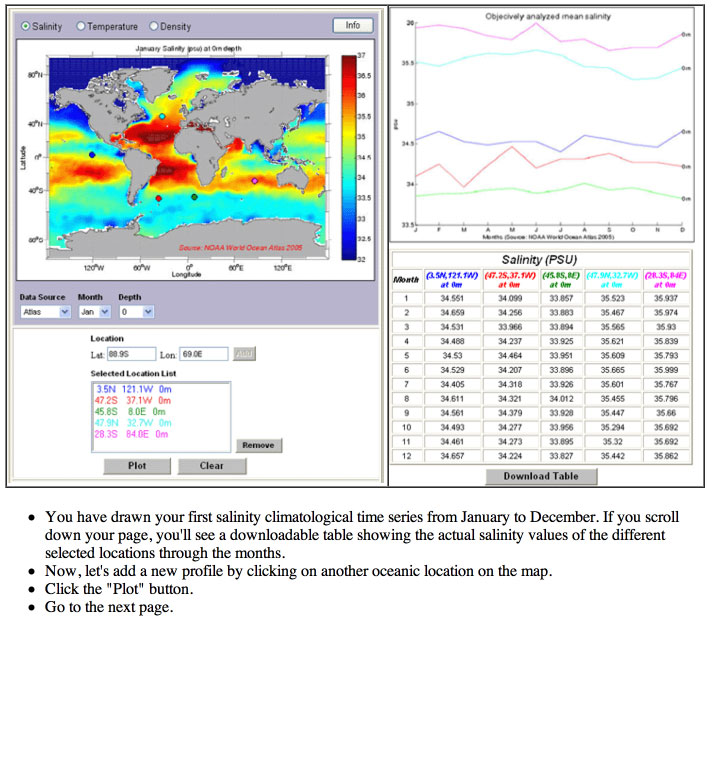
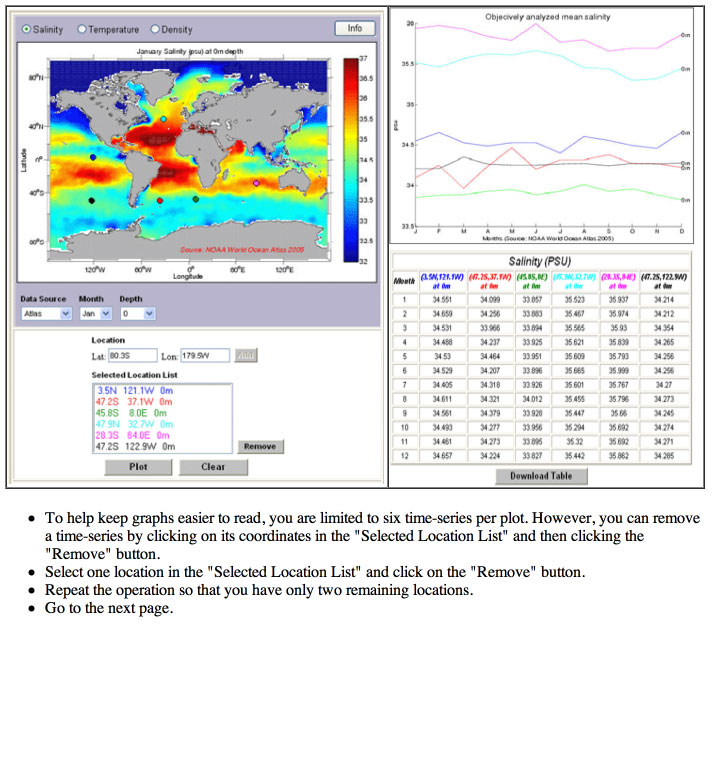
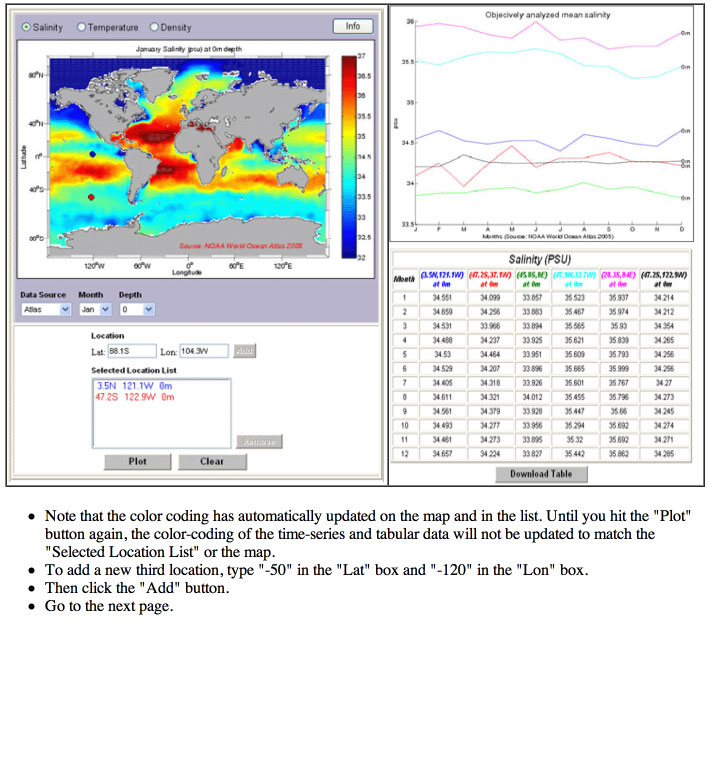
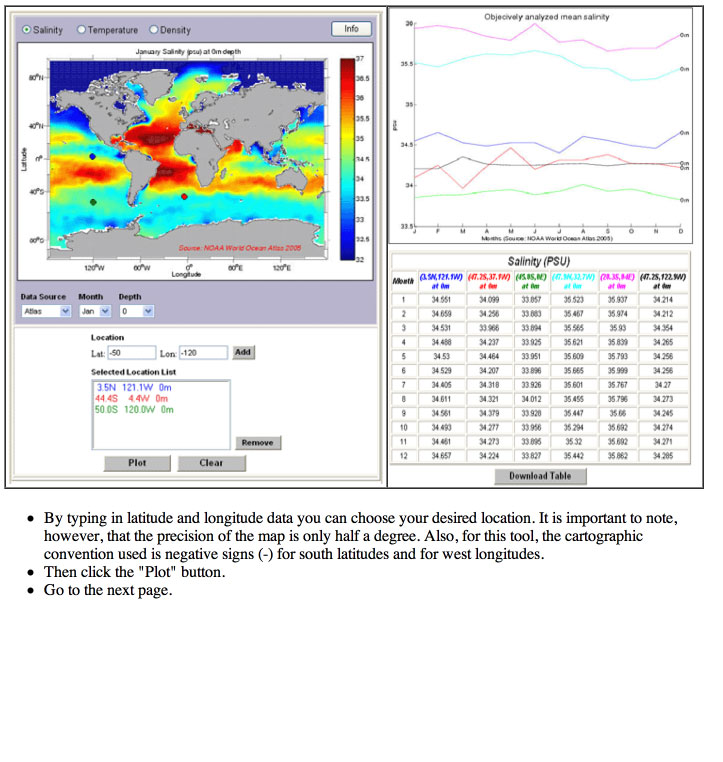
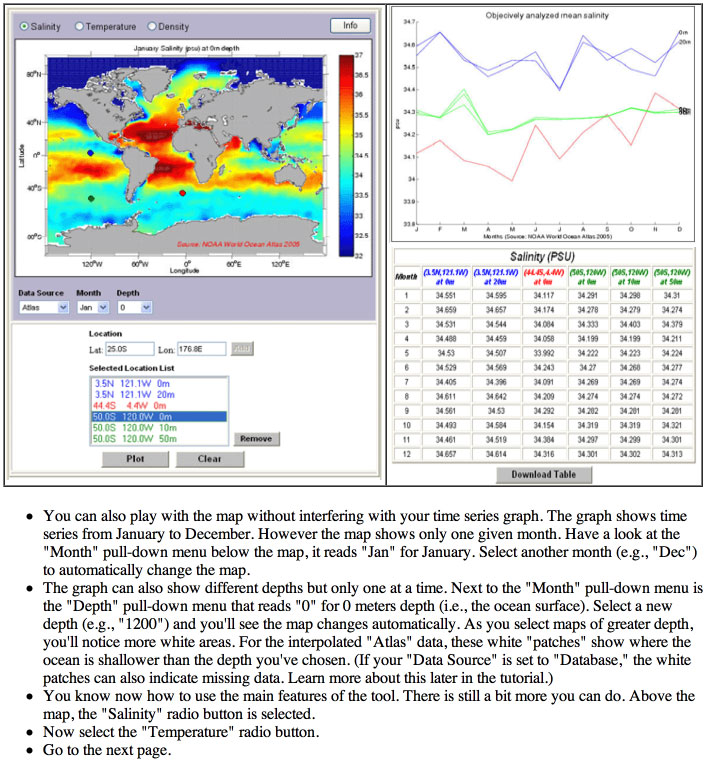
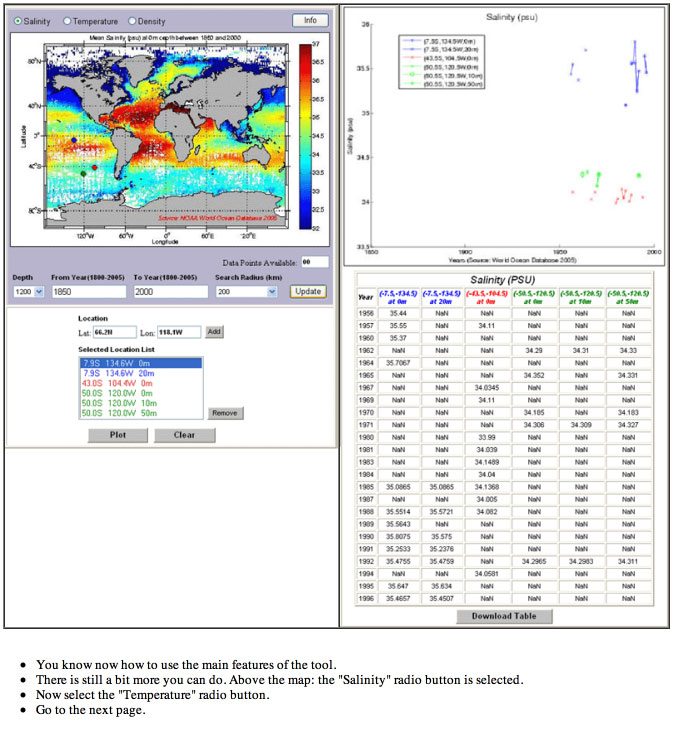
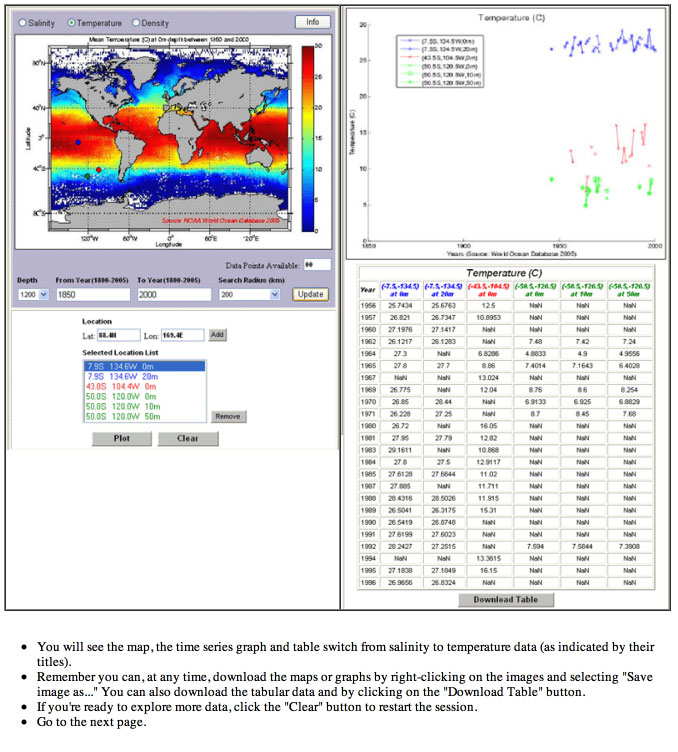
Maps of salinity, temperature, or density data averaged over a year can be clicked to create in-water profiles at up to six locations. Plotted data will also be displayed in a table (and downloadable as Excel files). Sources include interpolated atlas data (i.e., data gaps are filled in) or actual measurements from the database (i.e., data gaps are not filled in).
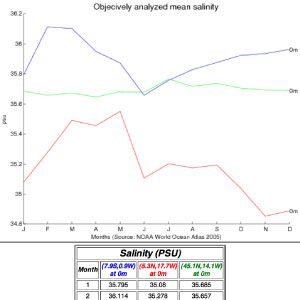
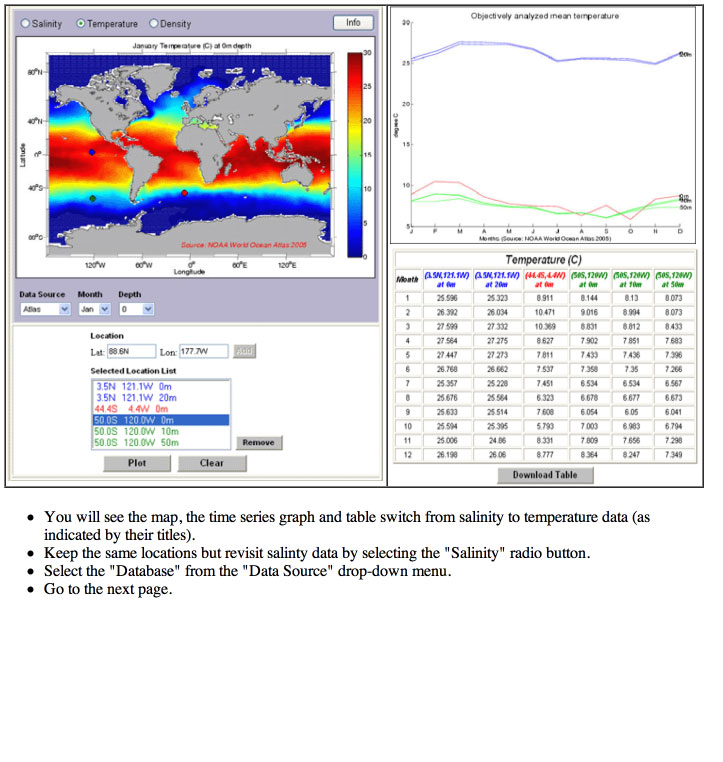
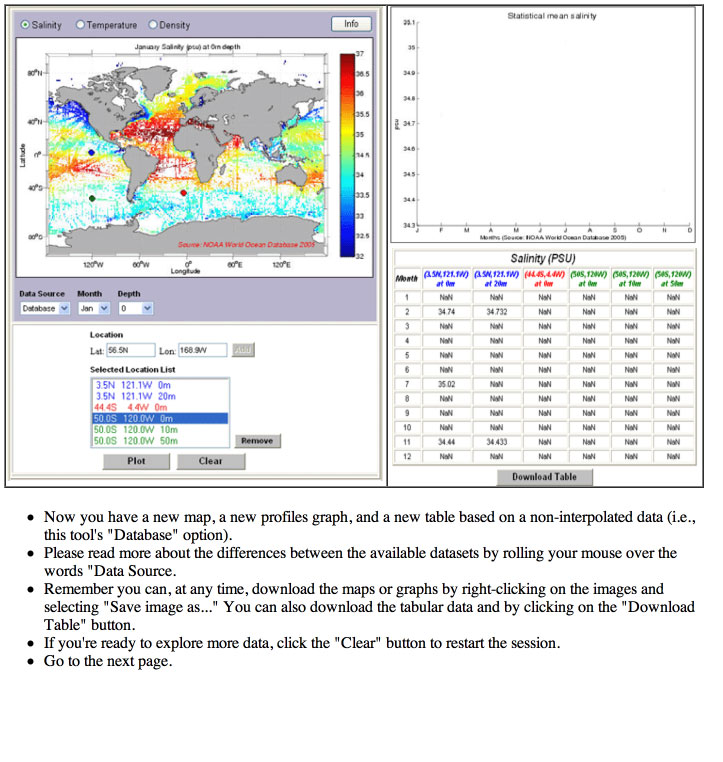
Create global maps of ocean conditions averaged over each month, from the surface down to 1500 meters (4921 feet). Monthly time-series graphs of salinity, temperature, or density can be plotted for up to six locations by clicking on the maps. Plotted data will also be displayed in a table (and downloadable as Excel files). Sources include interpolated atlas data (i.e., data gaps are filled in) or actual measurements from the database (i.e., data gaps are not filled in).
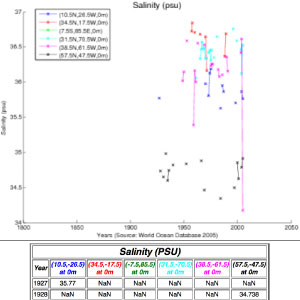
Create global maps of ocean conditions averaged over any year(s) from 1800 to 2005, from the surface down to 1500 meters (4921 feet). Annual time-series graphs of salinity, temperature, or density can be plotted by selecting up to six locations. Plotted data will also be displayed in a table (and downloadable as Excel files). Sources include interpolated atlas data (i.e., data gaps are filled in) or actual measurements from the database (i.e., data gaps are not filled in).
Aquarius Ocean Surface Salinity Data
Ocean surface salinity data from Aquarius are available by year, season, and month in two formats: 3D (GoogleEarth globe) and 2D (flat maps). Monthly data are presented as both means (i.e., data averaged over the month) and anomalies (i.e., differences from the annual average of Aquarius data). Animations of monthly means and anomalies are also available (2D format only).
Questions That Can Be Explored Using This Tool
- Is salinity uniform throughout the ocean?
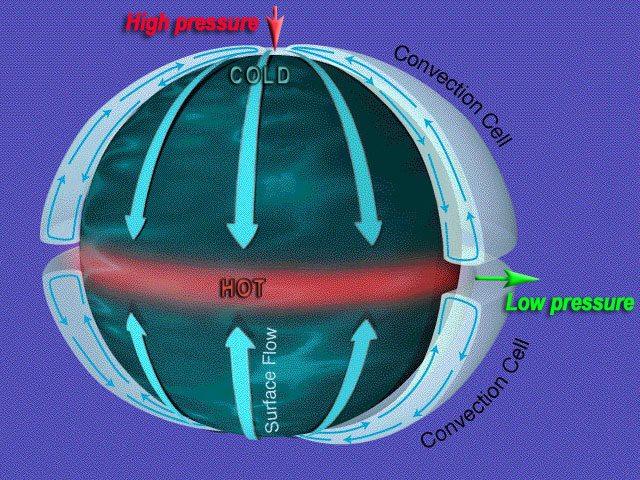
- No. Although the amount of salt in the ocean is relatively constant on time scales of years to decades, sea surface salinity (SSS) varies because freshwater input & output - part of the global hydrologic or water cycle - varies from place-to-place. The large scale pattern of evaporation and precipitation is established by earth's atmospheric convection cells. In the simplest case - for example, if earth were covered by oceans and not spinning - the atmosphere would move heat between the hot tropics and cold poles in a very simple way. Hot air would rise along the equator, creating a band of low atmospheric pressure. Cold air would sink at the poles, creating regions of high atmospheric pressure.
The presence of continents and earth's rotation complicates the idealized "two cell" system. A fairly realistic model of earth's atmospheric circulation consists of six cells: three on each side of the equator. This pattern has atmospheric pressure highs at the poles, 30°N and 30°S. It also has atmospheric lows along the equator, 60°N and 60°S. Away from the poles, cloudiness and precipitation (P) dominate bands of low pressure: these latitudes host the world's rainforests. Dryness and evaporation (E) dominate bands of high pressure: these latitudes are home to deserts.
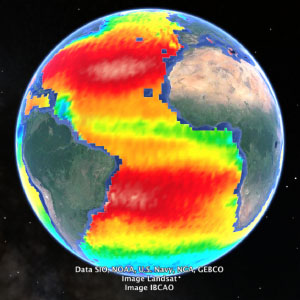
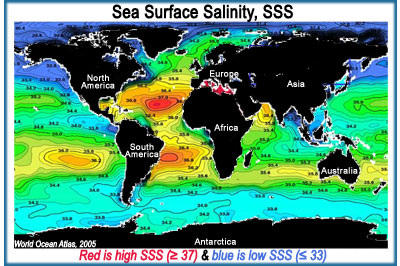
In terms of SSS, lower salinity generally occurs where precipitation is greater than evaporation (P>E). Higher SSS generally occurs where evaporation is greater than precipitation (E>P). Compare the "six cell" model with the map of global average SSS (image upper right). How well do SSS patterns mirror bands of high and low atmospheric pressure? In places where they do not match, what other types of freshwater inputs & outputs might be occurring?
- What is the range of ocean surface salinity in Earth's ocean?
Ocean surface salinity generally ranges from 32 practical salinity units (psu, which are roughly equivalent to parts per thousand) to 37 psu, but may be as high as 42 psu in the Red Sea or as low as 8 psu in the Baltic Sea.
- Which is the saltiest ocean basin?
The Atlantic Ocean. Why? For the most part, the salinity of the surface waters in each of the ocean basins is established by the amount of local precipitation - which would tend to make the surface waters fresher - relative to the amount of local evaporation - which would tend to make the surface waters saltier. Areas where the local evaporation exceeds local precipitation tend to be saltier than those where precipitation dominates. The Atlantic Ocean is a basin with strong evaporation relative to precipitation, with this situation reversed in the Pacific.
- Where are the saltiest waters in the Atlantic, Indian, and Pacific?
In all of these ocean basins, the saltiest regions are located at mid-latitudes, around 20°N and around 20°S.
- Where, in general, are the freshest surface waters?
The freshest waters are found in the Antarctic Ocean and in the upper latitudes of the Northern Hemisphere, above 40°N.
- How does large-scale atmospheric circulation influence global patterns on land and sea?
- The large-scale pattern of evaporation and precipitation is established by Earth's atmospheric dynamics. Hot air rises above the equator and cools while it moves polewards, creating a band of low atmospheric pressure in the equatorial region. At the poles, cold air sinks and warms while moving equator-ward, creating regions of high atmospheric pressure near the poles.
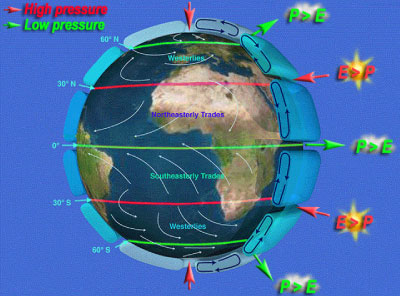
This heating pattern - coupled with the rotation of Earth - produces a general pattern with atmospheric pressure highs (red arrows) at the poles at at 30°N and 30°S. In these "high pressure" regions, evaporation (E) is greater than precipitation (P) and deserts are likely to occur. Along Earth's equator and at 30°N and 30°S, atmospheric lows (green arrows) are zones in which precipitation exceeds evaporation (P > E).
- How does large-scale atmospheric circulation influence patterns on land?
Away from the poles, cloudiness and precipitation dominate bands of low pressure: these latitudes host the world's rain forests. Evaporation dominates bands of high pressure: these latitudes are home to deserts. These general patterns can be seen in an animation of Earth's Normalized Difference Vegetation Index (NDVI), which shows the density of vegetation.
- How does large-scale atmospheric circulation influence ocean surface salinity patterns?
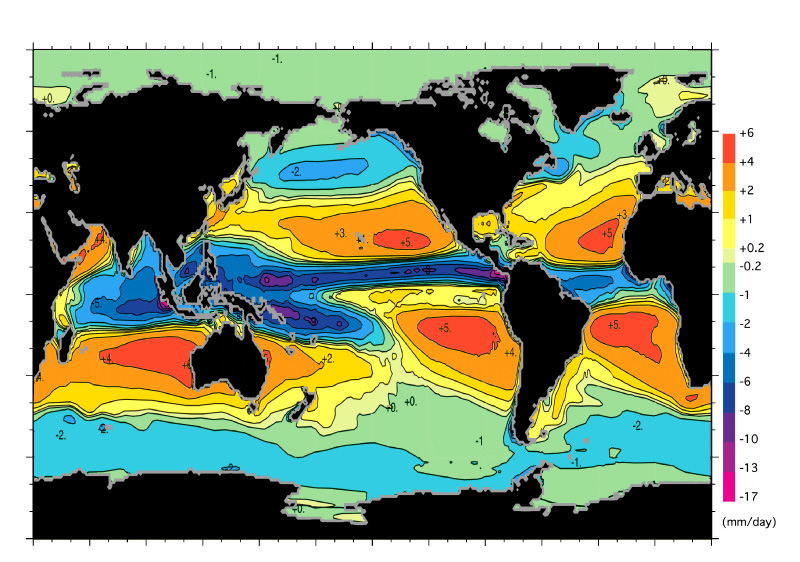
- Lower ocean surface salinity generally occurs where precipitation is greater than evaporation. Conversely, higher salinity generally occurs where evaporation is greater than precipitation. Use the Aquarius Salinity Data tool to view an image of average evaporation minus precipitation.
- What is the contribution of fresh water from rivers to the oceans?
It depends on the time and which river you're examining. Watch the animation Changes in Global Sea Surface Salinity to look for areas of low salinity (dark blue) that fluctuate over time and which are adjacent to continents. Likely regions are the mouths of the largest rivers of the world: Rio de Plata, Amazon/Orinoco, Mississippi, Niger and Congo, Ganges, and Huang rivers. Interestingly, the flux of fresh water coming from the rivers into the ocean is ten times less than the freshwater input from precipitation.
- How far does sea ice extend in the polar oceans?
It depends on the season, year, and which pole you're examining. For example, the area of sea ice in the Antarctic that melts in summer is about 14 million square kilometers (~ 5.4 million square miles). This is equivalent to the area covered by the entire Antarctic landmass. Explore the weekly Brightness Temperature data maps from Aquarius, which are used to monitor the extent of ice coverage at the north and south poles.

Historical Ocean Data
We have developed a set of interactive tools to explore historical salinity, temperature, and density data sets (2005
NOAA World Ocean Atlas & Database for the "Flat Map Interface" and 2009 NOAA World Ocean Atlas & Database for the "GoogleEarth
Interface"). These data are available as the following three distinct yet complementary tools:Annual Mean Data
Maps of salinity, temperature, or density data averaged over a year can be clicked to create in-water profiles at up to six locations. Plotted data will also be displayed in a table (and downloadable as Excel files). Sources include interpolated atlas data (i.e., data gaps are filled in) or actual measurements from the database (i.e., data gaps are not filled in).
Questions That Can Be Explored Using This Tool
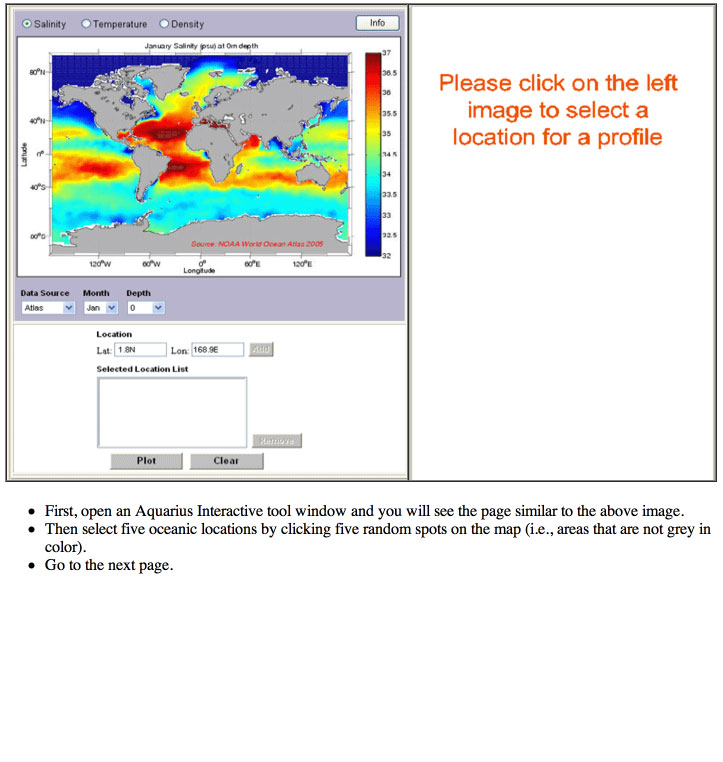
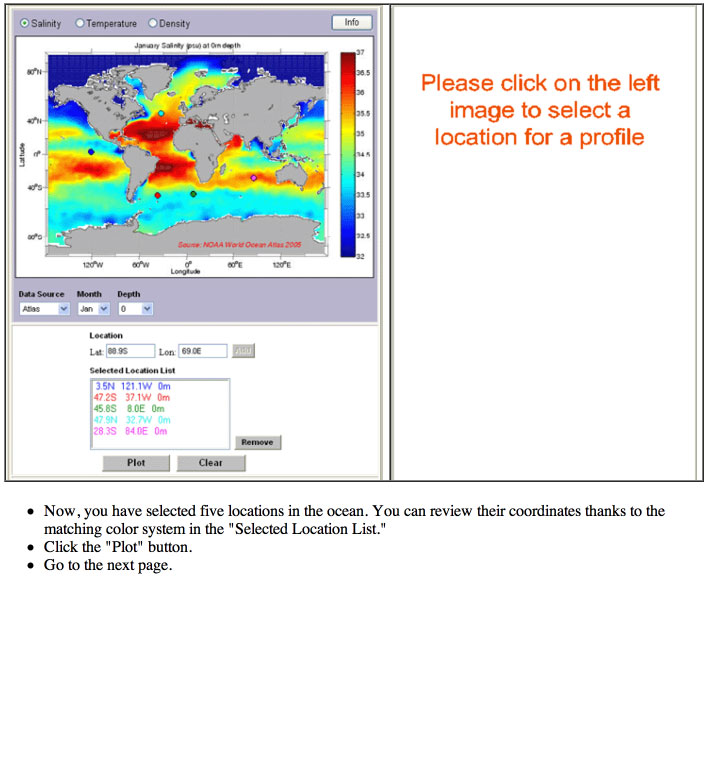
Changes in Monthly Mean Data
Create global maps of ocean conditions averaged over each month, from the surface down to 1500 meters (4921 feet). Monthly time-series graphs of salinity, temperature, or density can be plotted for up to six locations by clicking on the maps. Plotted data will also be displayed in a table (and downloadable as Excel files). Sources include interpolated atlas data (i.e., data gaps are filled in) or actual measurements from the database (i.e., data gaps are not filled in).
Questions That Can Be Explored Using This Tool
Changes in Annual Mean Data
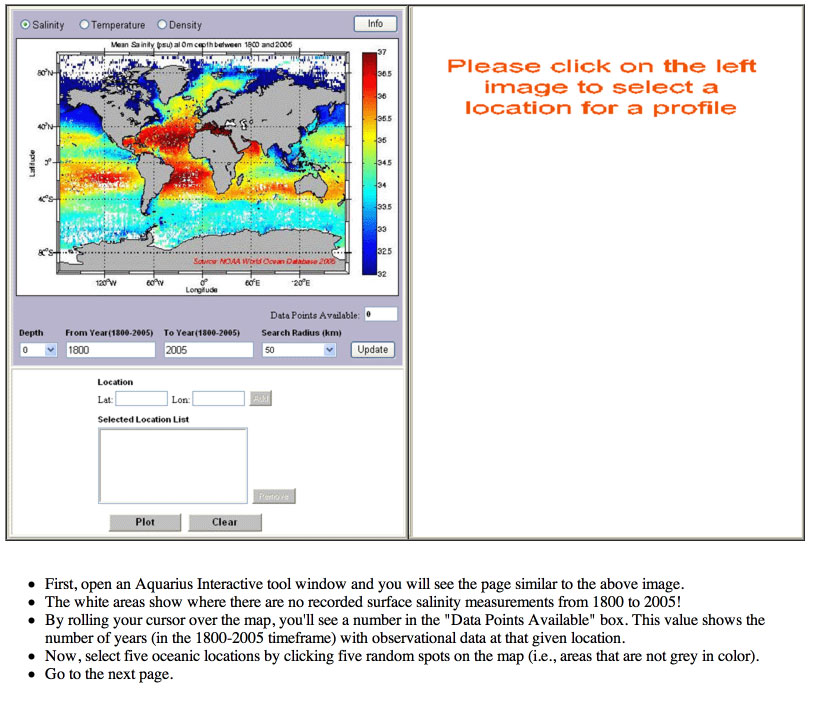
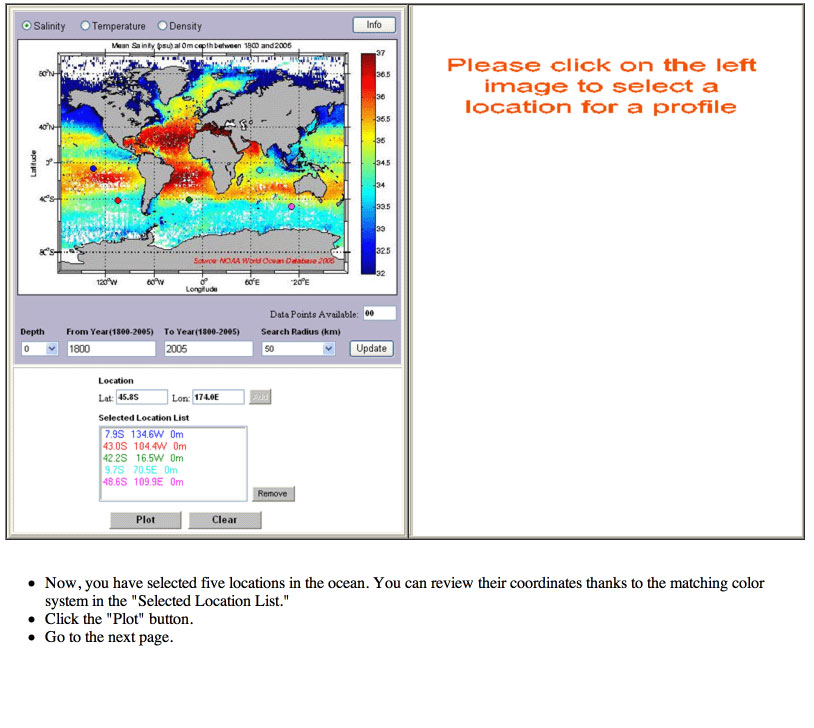
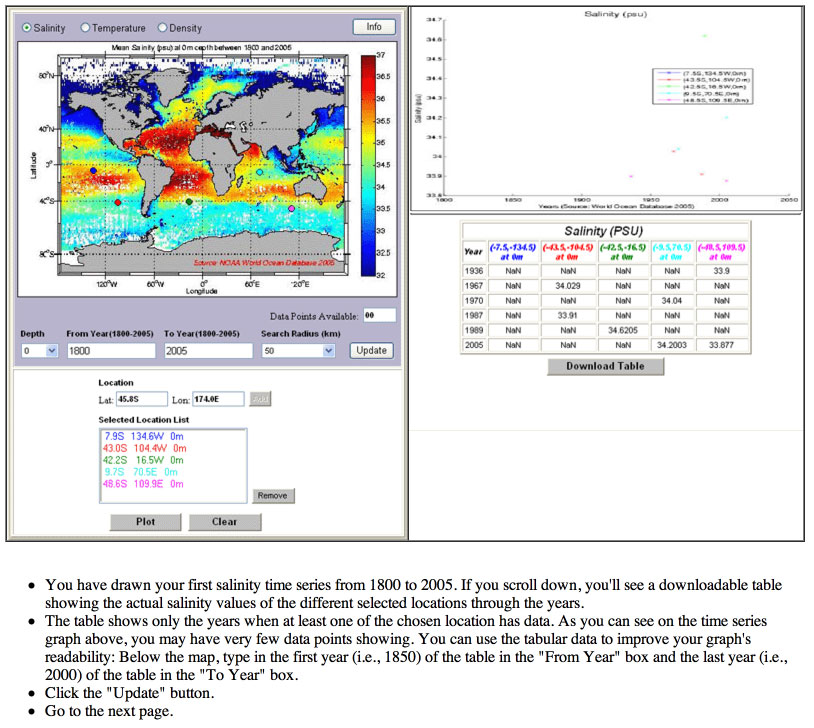
Create global maps of ocean conditions averaged over any year(s) from 1800 to 2005, from the surface down to 1500 meters (4921 feet). Annual time-series graphs of salinity, temperature, or density can be plotted by selecting up to six locations. Plotted data will also be displayed in a table (and downloadable as Excel files). Sources include interpolated atlas data (i.e., data gaps are filled in) or actual measurements from the database (i.e., data gaps are not filled in).
Questions That Can Be Explored Using This Tool