Argo Data Visualization

Professor
University of North Carolina
University of North Carolina
Dr. Bingham received his Ph.D. from the University of California, San Diego in Oceanography. His research interests include global distributions of sea surface salinity and large scale regional physical oceanography in the Kuroshio, the western North and Equatorial Pacific, and Onslow Bay, North Carolina.
Webinar Clip
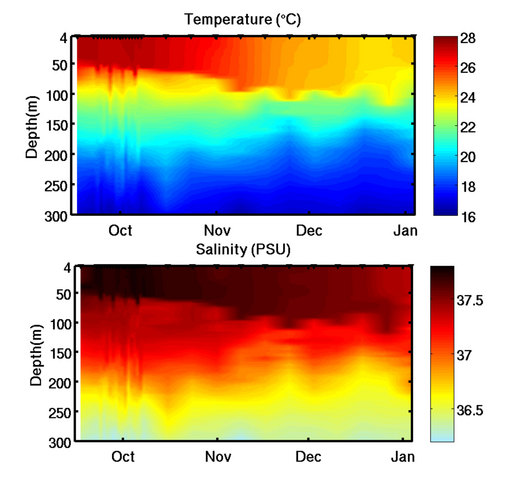
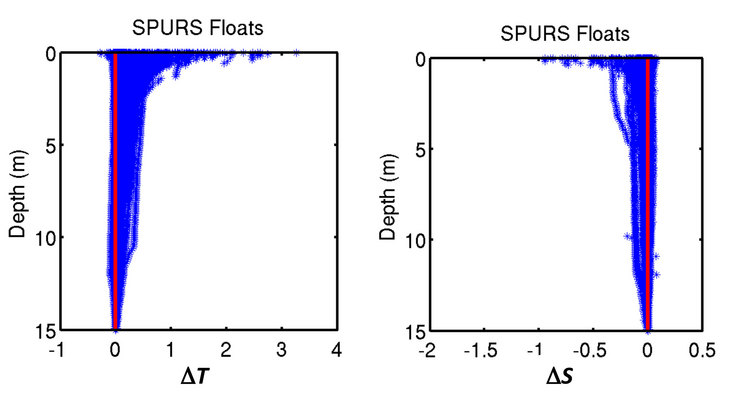
When an Argo float surfaces at sea, it transmits data to a satellite which is then processed at an information center in France. One of the measurements the Argo floats are making is sea salinity at various depths: how does it change from place to place? Dr. Fred Bingham walks us through what that data might look like when visualized from month to month and this gives us an idea of how salinity varies throughout the year. This information is important when considering questions such as, "What is making the ocean surface saltier or fresher?". Full webinar: Follow that Salt! Results and the Future of Salinity Exploration
Click here for a transcript of this clip (PDF, 34.6 KB). |
Resources
Applicable Science Standards
 Asking Questions and Defining Problems. A practice of science is to ask and refine questions that lead to descriptions and explanations of how the natural and designed world(s) works and which can be empirically tested.
 Analyzing and Interpreting Data. Scientific investigations produce data that must be analyzed in order to derive meaning. Because data patterns and trends are not always obvious, scientists use a range of tools - including tabulation, graphical interpretation, visualization, and statistical analysis - to identify the significant features and patterns in the data. Scientists identify sources of error in the investigations and calculate the degree of certainty in the results. Modern technology makes the collection of large data sets much easier, providing secondary sources for analysis.
 Using Mathematics and Computational Thinking. In both science and engineering, mathematics and computation are fundamental tools for representing physical variables and their relationships. They are used for a range of tasks such as constructing simulations; solving equations exactly or approximately; and recognizing, expressing, and applying quantitative relationships.