Ocean Salinity Differences: Surface vs. Deep

Professor
University of Washington
University of Washington
Dr. Riser's primary interests include the ocean's role in climate; circulation of the ocean and ocean/atmosphere/ice interactions through direct observations; and the interactions between physical aspects of circulation and the biogeochemical properties of the ocean.
Webinar Clip
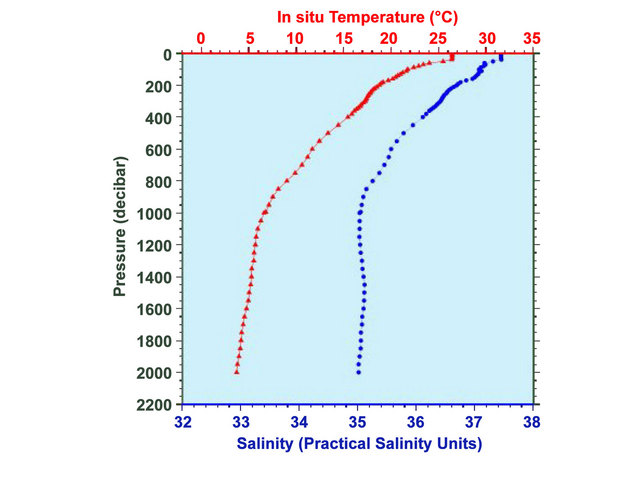
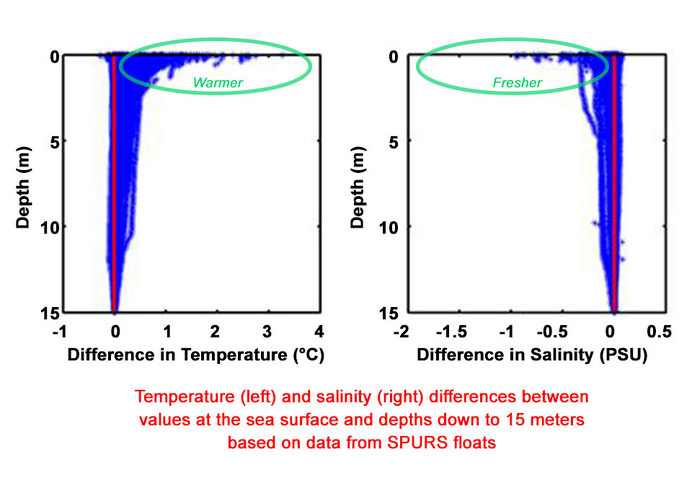
In this clip, Dr. Riser walks viewers through actual data collected from an Advanced Argo Float in the SPURS (Salinity Processes in the Upper Ocean Regional Study) region of the mid-Atlantic Ocean. We learn that temperature and salinity remain fairly consistent at depth and only at the surface are changes visible. In observing these changes at the surface, we can make inferences as to how temperature and salinity change.Full webinar: From Skin To Deep
Click here for a transcript of this clip (PDF, 37.7 KB). |
Resources
Applicable Science Standards
 Analyzing and Interpreting Data. Scientific investigations produce data that must be analyzed in order to derive meaning. Because data patterns and trends are not always obvious, scientists use a range of tools - including tabulation, graphical interpretation, visualization, and statistical analysis - to identify the significant features and patterns in the data. Scientists identify sources of error in the investigations and calculate the degree of certainty in the results. Modern technology makes the collection of large data sets much easier, providing secondary sources for analysis.