What Does Salinity Look Like?

Professor
University of Washington
University of Washington
Dr. Riser's primary interests include the ocean's role in climate; circulation of the ocean and ocean/atmosphere/ice interactions through direct observations; and the interactions between physical aspects of circulation and the biogeochemical properties of the ocean.
Webinar Clip
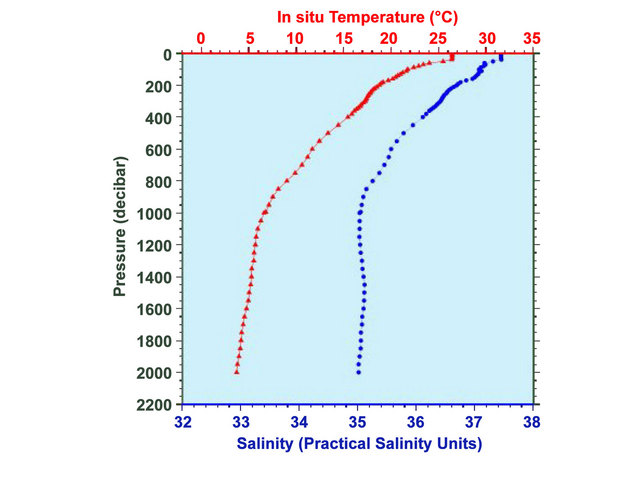
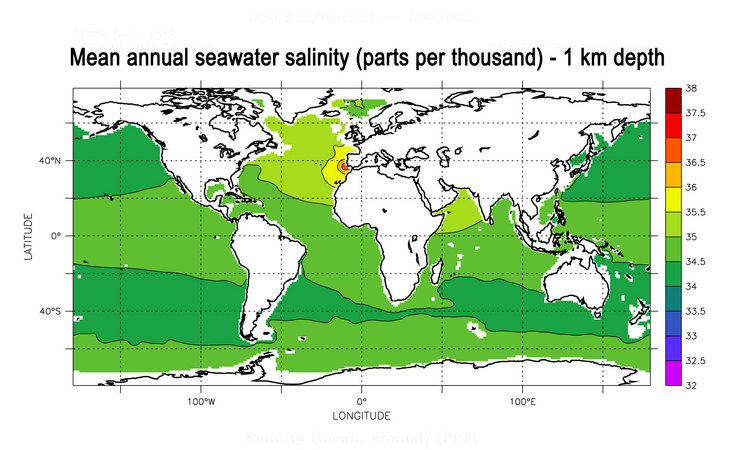
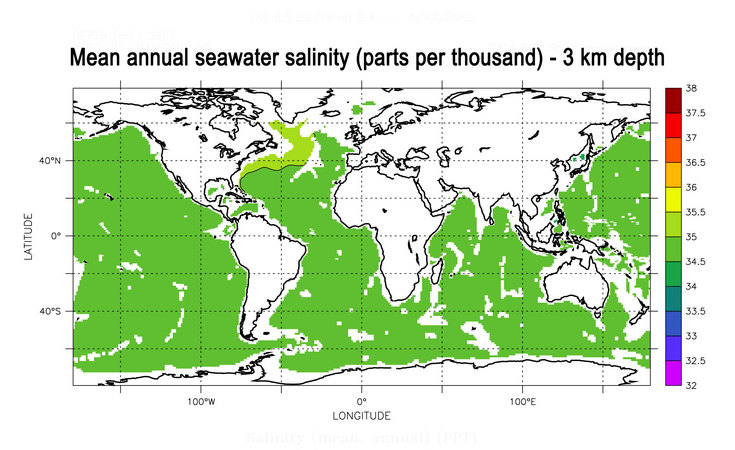
While sea surface salinity varies throughout the worlds' oceans, viewers may be surprised to learn that throughout the water column, from surface to deep, salinity is not changing all that much. Dr. Riser explains why in this clip, through the use of various graphs and schematics. Full webinar: From Skin To Deep
Click here for a transcript of this clip (PDF, 43.6 KB). |
Resources
Applicable Science Standards
 Analyzing and Interpreting Data. Scientific investigations produce data that must be analyzed in order to derive meaning. Because data patterns and trends are not always obvious, scientists use a range of tools - including tabulation, graphical interpretation, visualization, and statistical analysis - to identify the significant features and patterns in the data. Scientists identify sources of error in the investigations and calculate the degree of certainty in the results. Modern technology makes the collection of large data sets much easier, providing secondary sources for analysis.