How Do Scientists Visualize Ocean Salinity?

Associate Scientist
Woods Hole Oceanographic Institution
Woods Hole Oceanographic Institution
Dr. Farrar received his Ph.D. in Physical Oceanography from the MIT-WHOI Joint Program in Oceanography. His research interests include air-sea interaction and exchange; dynamics and thermodynamics of the upper ocean; tropical dynamics and equatorial waves; oceanic internal waves and eddies; satellite oceanography; and ocean observing and instrumentation.
Webinar Clip
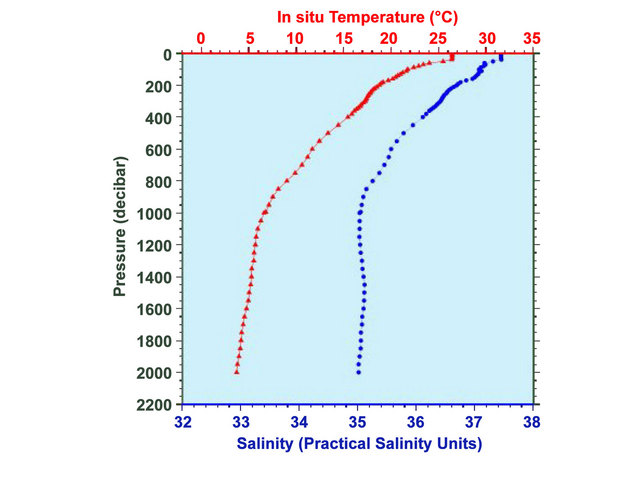
While we know that the oceans are salty and that this saltiness varies from place to place (fresher in tropical regions, saltier in desert regions), scientists need to find ways to see and visualize this information so as to really get a sense of how salinity might be changing. To do this, salinity measurements are collected and these data are plotted on what is known as a temperature-salinity diagram. Here, Dr. Farrar interprets one of these diagrams and what the given values represent.Full webinar: Ocean Thinking: Balanced Budget? Oh, Buoy!
Click here for a transcript of this clip (PDF, 36.2 KB). |
Resources
Applicable Science Standards
 Asking Questions and Defining Problems. A practice of science is to ask and refine questions that lead to descriptions and explanations of how the natural and designed world(s) works and which can be empirically tested.
 Analyzing and Interpreting Data. Scientific investigations produce data that must be analyzed in order to derive meaning. Because data patterns and trends are not always obvious, scientists use a range of tools - including tabulation, graphical interpretation, visualization, and statistical analysis - to identify the significant features and patterns in the data. Scientists identify sources of error in the investigations and calculate the degree of certainty in the results. Modern technology makes the collection of large data sets much easier, providing secondary sources for analysis.
 Using Mathematics and Computational Thinking. In both science and engineering, mathematics and computation are fundamental tools for representing physical variables and their relationships. They are used for a range of tasks such as constructing simulations; solving equations exactly or approximately; and recognizing, expressing, and applying quantitative relationships.