Education: Using Mathematics and Computational Thinking
|
|
Aquarius First Light Data (00:05:47)
In this clip, Dr. Gary Lagerloef discusses how scientists were able to use Aquarius data to observe major freshwater events in the Amazon River outflow and the Bay of Bengal.
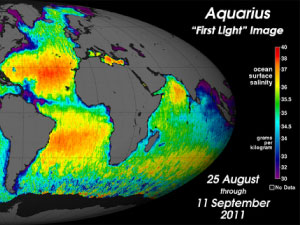
Aquarius Sees the Gulf of Mexico (00:02:48)
Dr. Gary Lagerloef uses data collected from NASA's Aquarius satellite to show ocean processes taking place in the Gulf of Mexico (September, 2011).
Argo Data Visualization (00:02:33)
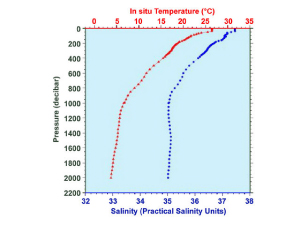
Argo floats measure salinity at pre-programmed depths on a regular schedule, sending data back to oceanographers to view. Dr. Fred Bingham walks us through what that data might look like when visualized from month to month and this gives us an idea of how salinity varies throughout the year.
How Do Scientists Visualize Ocean Salinity? (00:03:57)
Simply gathering oceanographic data is not enough: scientists must then translate that data into something they can see and interpret. Learn how by watching this video!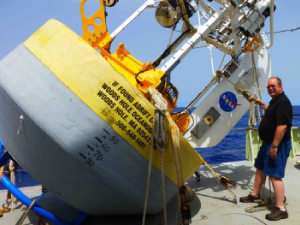
In-Situ Oceanographic Research Equipment (00:06:06)
Dr. Eric Lindstrom explains the complex features of the sensor web used during SPURS and their functions within the web. He talks about the technology used in each of them (many use satellite-tracking) and the kinds of data that can be collected from them.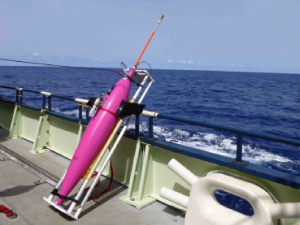
Introduction to Seagliders (00:02:03)
There are surface drifters and wave gliders, so what constitutes a seaglider? Dr. Fred Bingham tells us in this clip, and shares how these drifters helped researchers to better understand the SPURS region.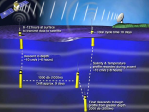
Introduction to the Argo Float Program (00:06:09)
Dr. Stephen Riser explains what an Argo float is and how it has increased scientists' knowledge of global ocean salinity since its implementation.
Introduction to the Prawler Mooring (00:03:04)
Dr. Fred Bingham introduces a specific type of instrument that "crawls" up and down a mooring line. The importance of this new technology, as well as what can happen if things go wrong, are discussed in this clip. 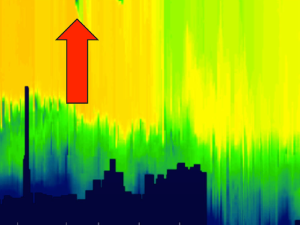
Lagrangian Float Data Visualization (00:02:24)
In this clip, data from a Lagrangian Float - as well as its interpretation - are shared.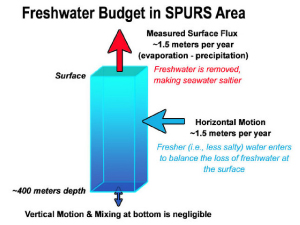
Remote Sensing in the 2000s (00:08:15)
Drs. David Le Vine and Gary Lagerloef explain how remote sensing has evolved throughout the past few decades, focusing specifically on ocean salinity research in the 2000s.
Seaglider Data Visualization (00:03:42)
This clip highlights the mechanisms by which a seaglider, a popular type of oceanographic research equipment, moves throughout the ocean and how it is able to collect and transmit data to satellites in space.
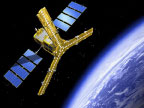
The Aquarius Satellite and SPURS (00:02:50)
Dr. Fred Bingham talks how using both satellites and in-situ equipment is creating a more accurate picture of processes occurring in the salty Atlantic.