Gallery: Brightness Temperature at High Latitudes
This page contains two sets of weekly gridded maps showing the Aquarius (L-band, about 1.4 GHz) brightness temperature (TB)
measurements recorded at vertical polarization in the high latitudes of the Northern Hemisphere (using
beam 1) and Southern Hemisphere (using beam 3). These beams point toward the Earth with different
angles, but they were considered because they offer the largest spatial coverage of each polar region. Microwave brightness
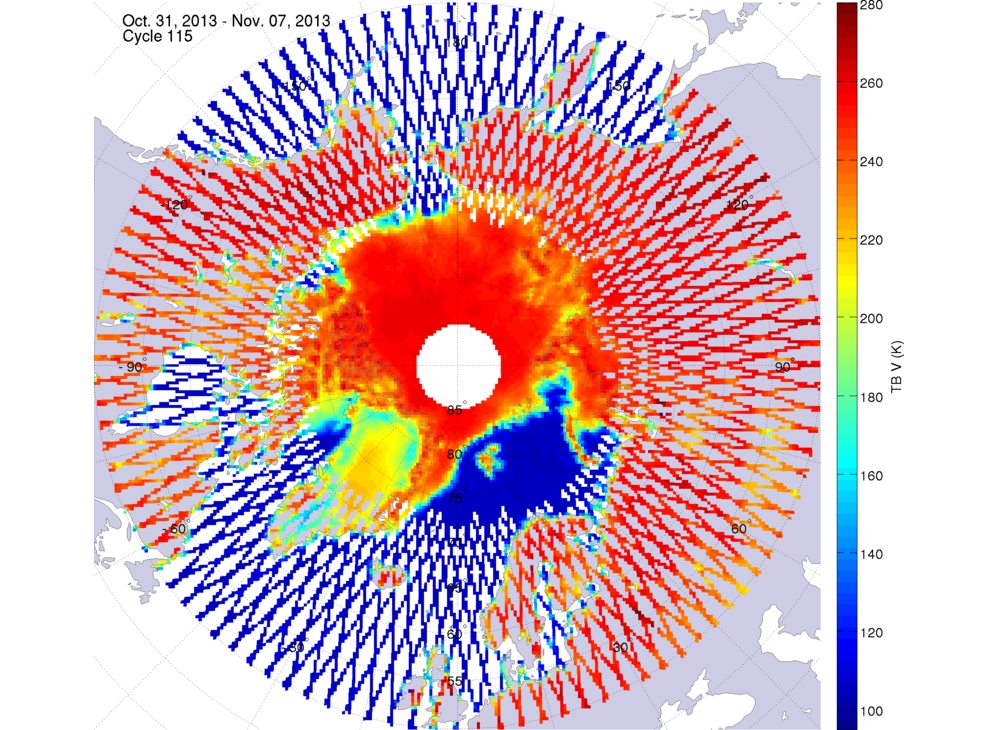
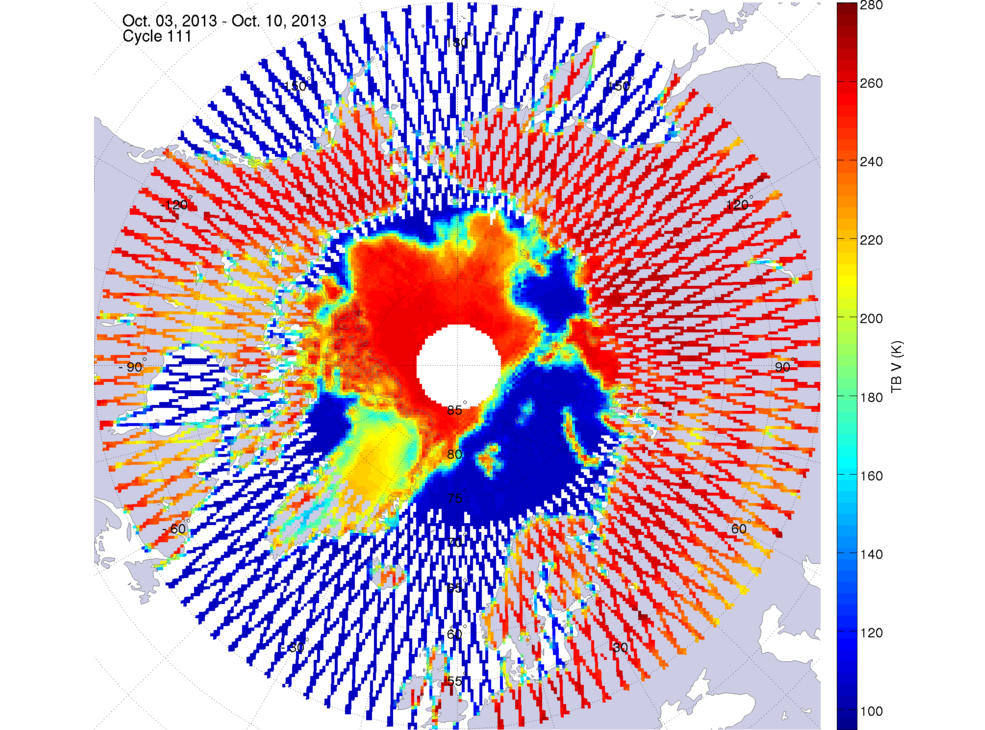
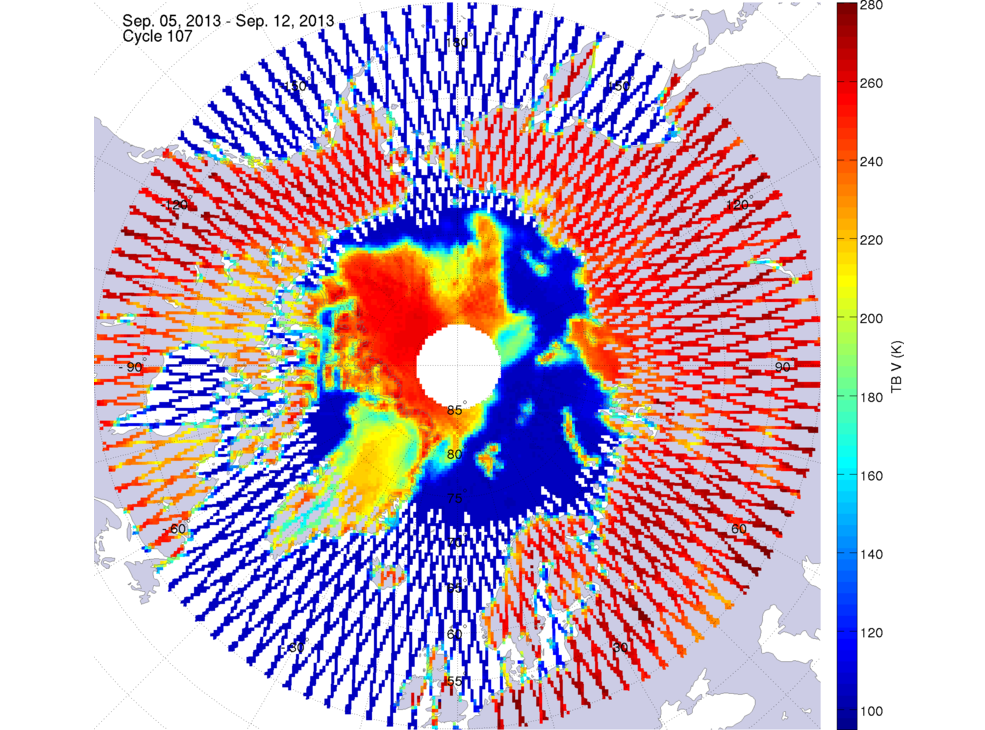
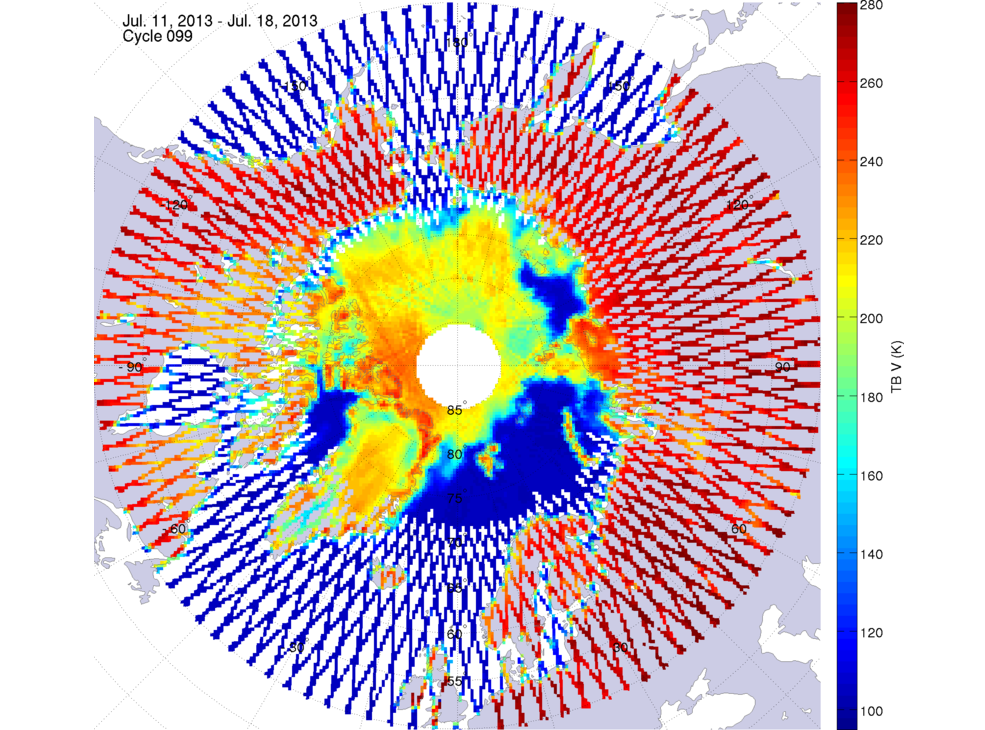
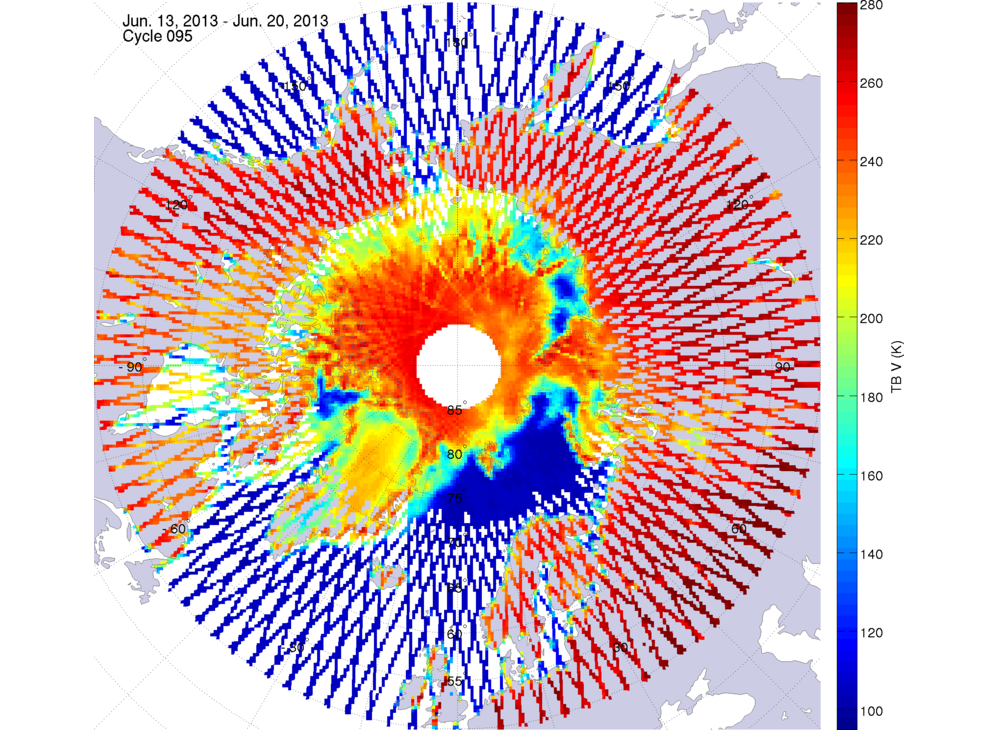
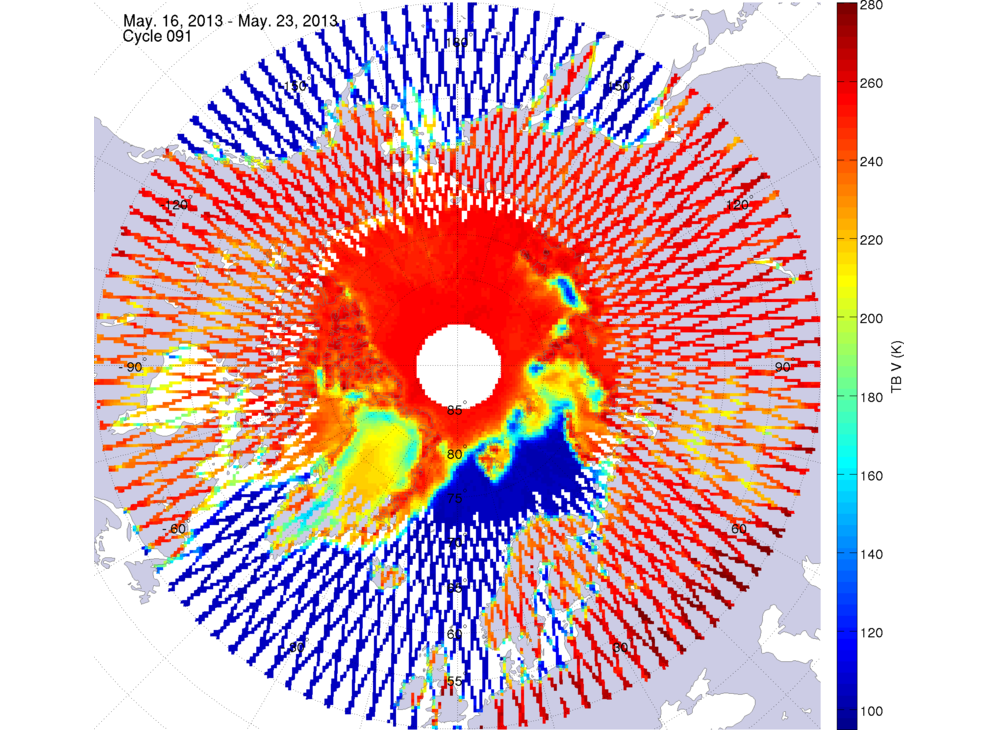
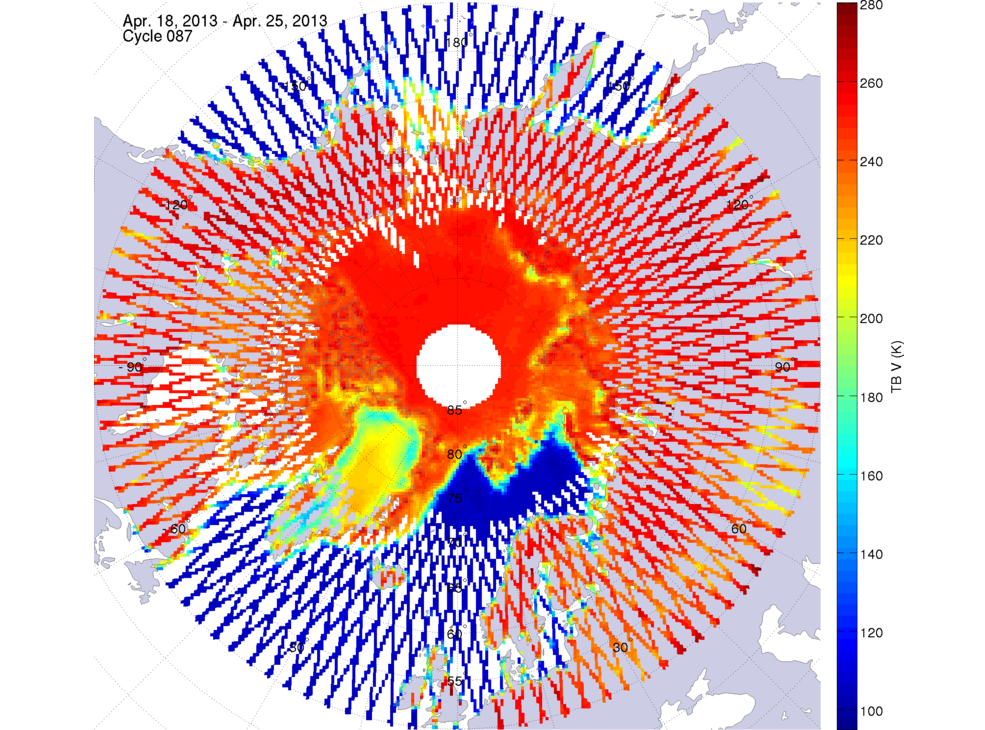
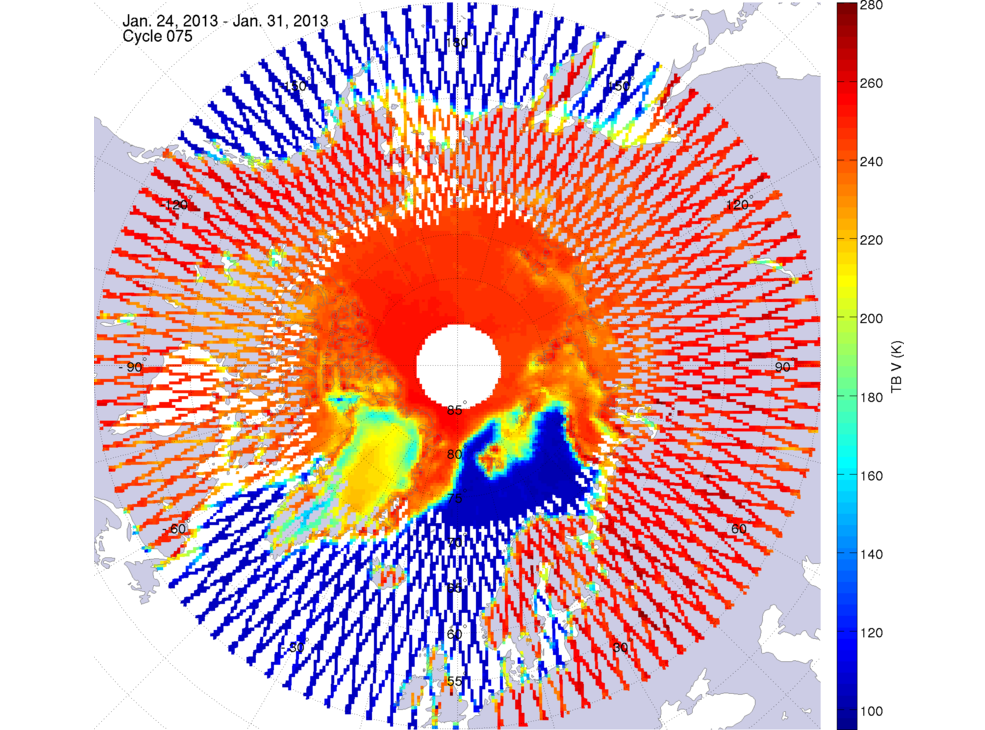
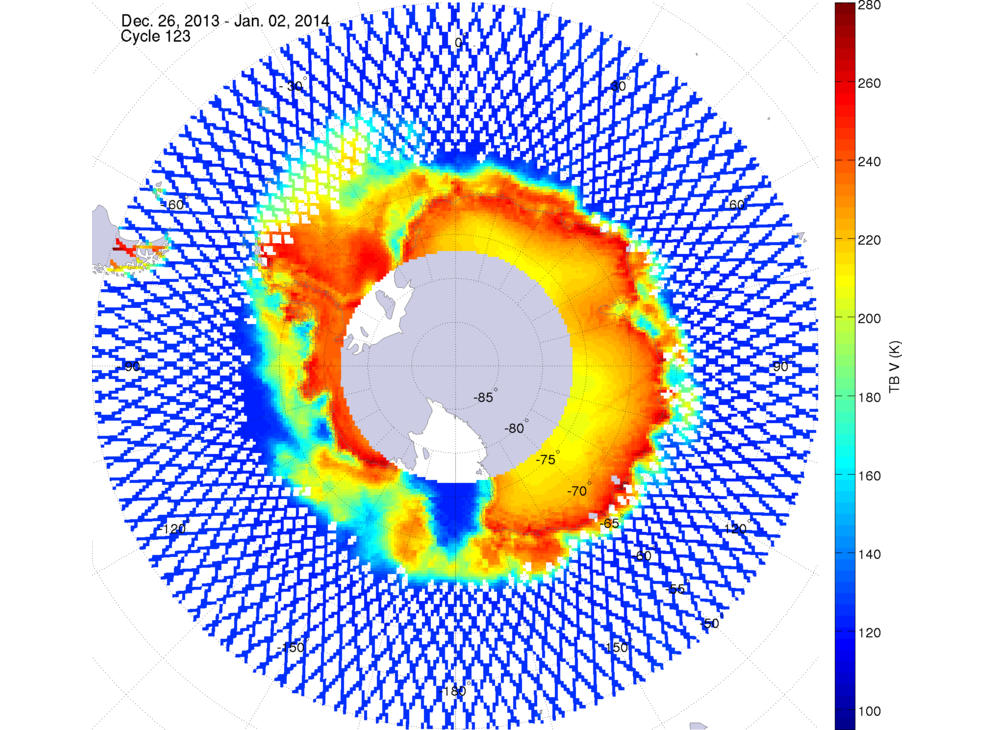
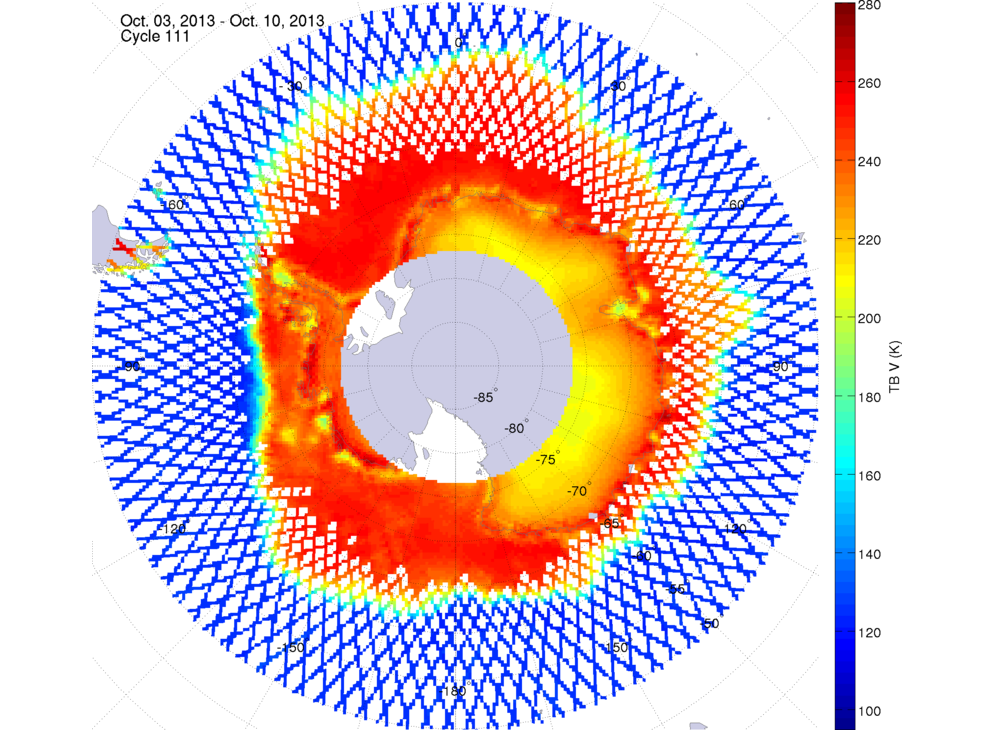
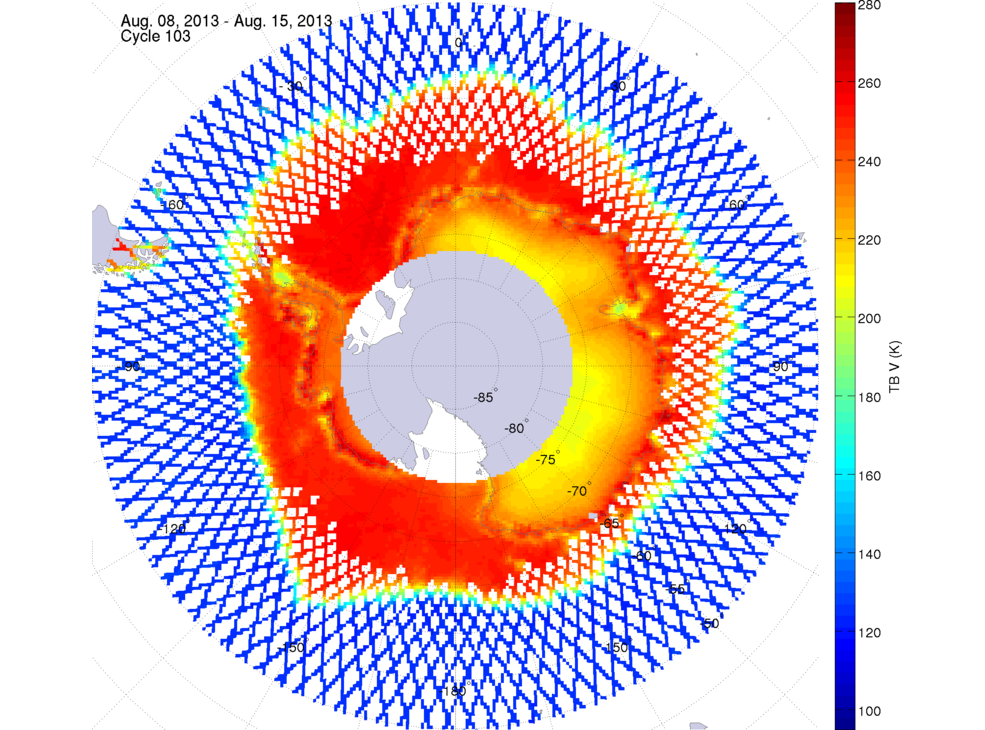
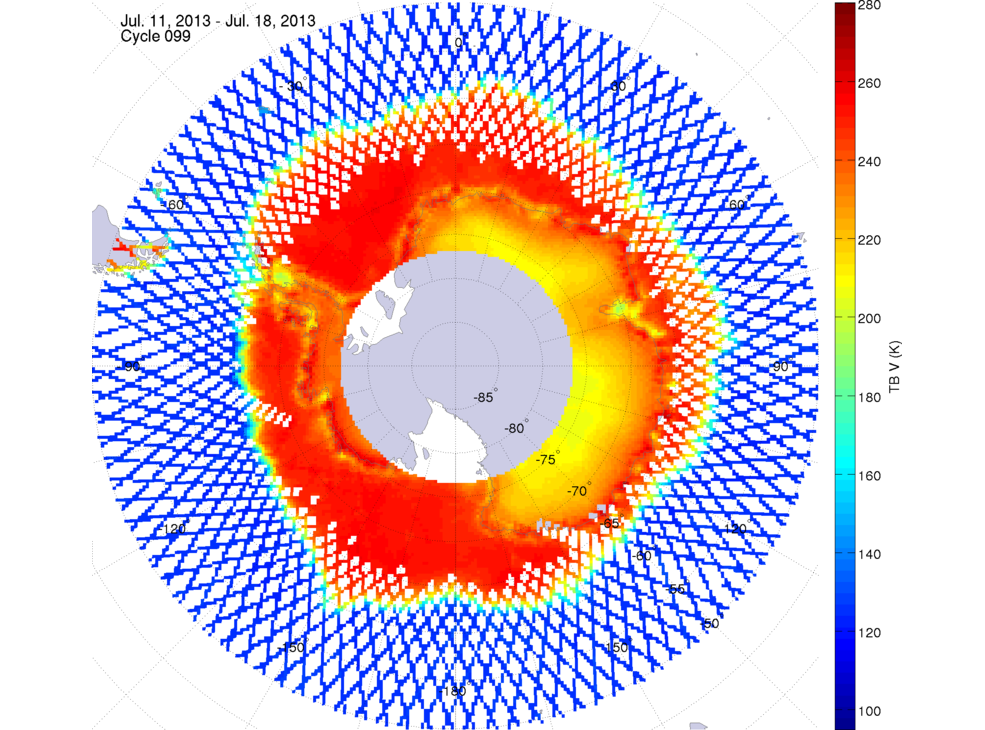
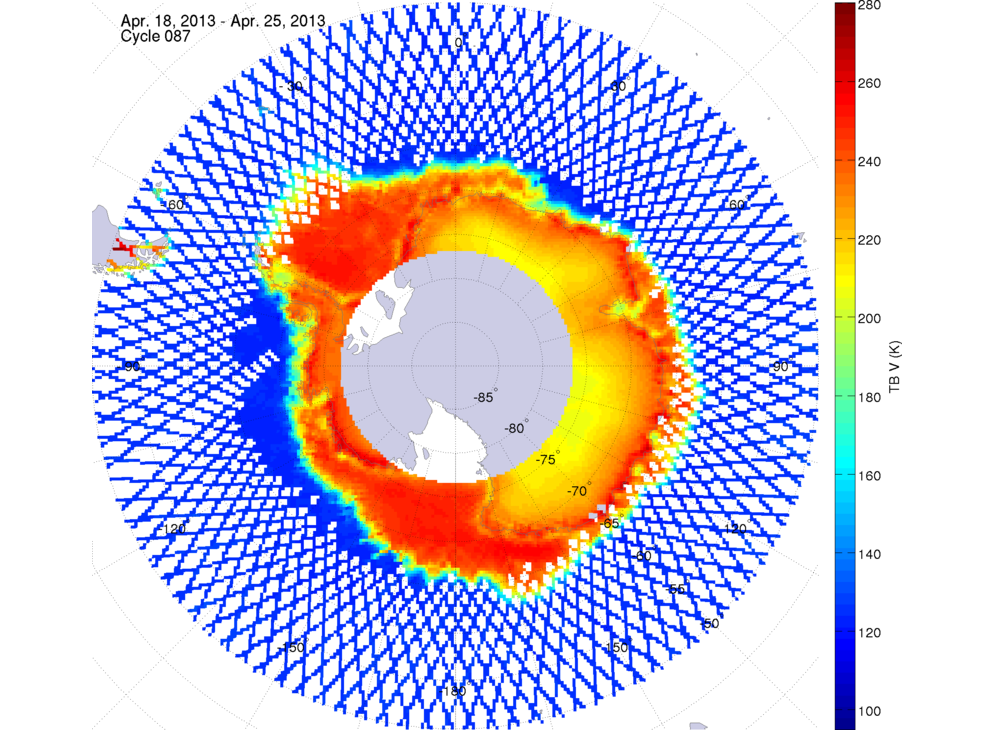
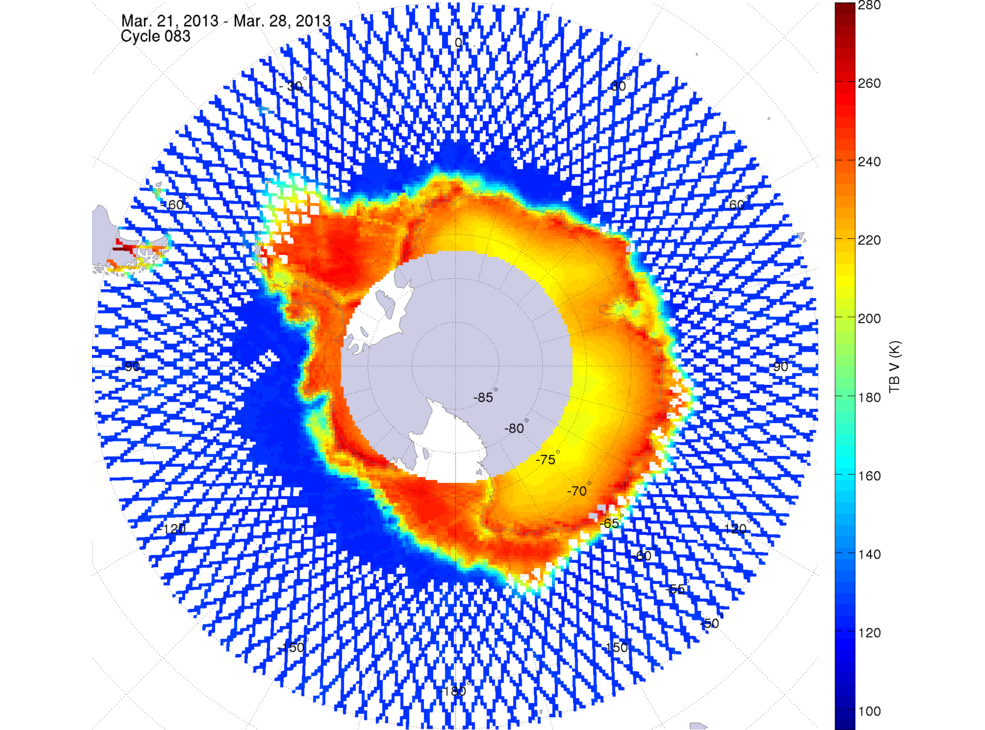
temperatures are expressed in Kelvin (K). Blue colors represent low TBs, whereas red colors represent high TBs. The date shown
on the images (below) is the first day of that weekly measurement.
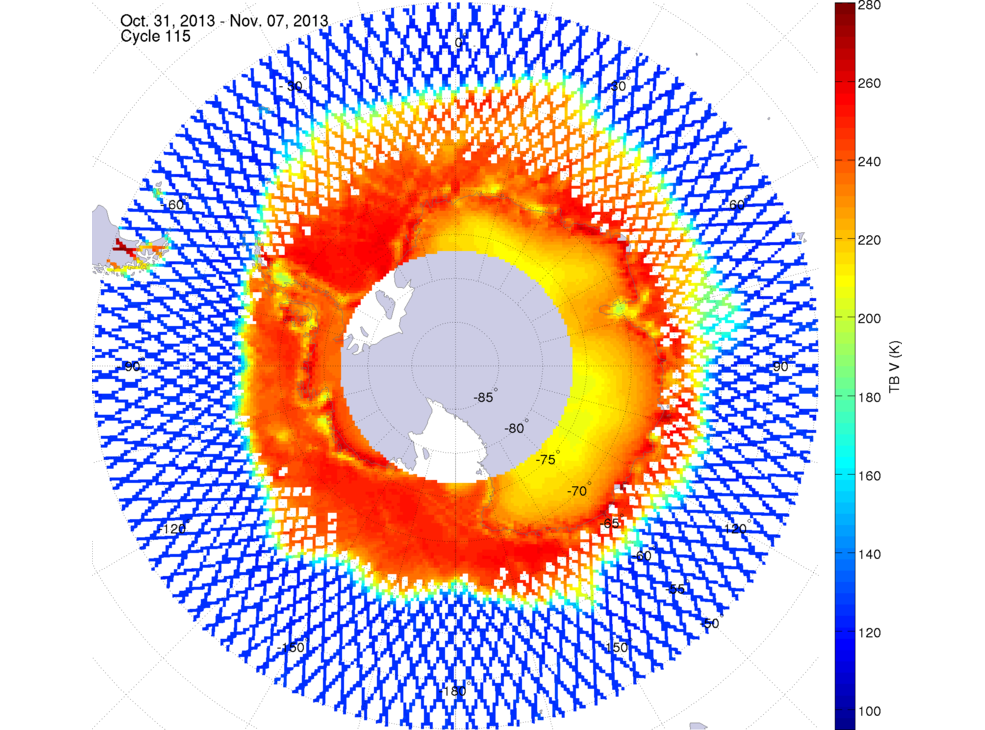
Over the polar region there is a large range of TBs. Where the ocean is not covered by sea ice, TBs are low (about 100 K). In contrast, where the ocean is covered by sea ice higher TBs are measured (about 170 to 270 K). The temporal and spatial distribution of the TBs over sea ice depends on the sea ice properties (e.g., concentration, thickness). Measurements over the Greenland and Antarctic ice sheets also vary according to the snow and ice properties (e.g. temperature, accumulation, presence of melting snow) but they are more stable than over sea ice, which drifts with the oceanic currents.
Scientists studying the Earth's cryosphere (e.g., ice sheet, sea ice, and permafrost) are motivated to use the Aquarius TB measurements because they contain new information about snow and ice properties. Over the ice sheets, Aquarius' measurements can provide us with information from hundreds of meters below the surface, hence centuries old ice in some places. Understanding these data could lead to new cryospheric applications such as the monitoring of long-term ice temperature changes, and snow accumulation over the ice sheets. Similar new applications exist for sea ice, and permafrost.
The data presented are a weekly gridded average of the swath data distributed by NASA's Physical Oceanography Distributed Active Archive Center (PO.DAAC) and provided by Ludovic Brucker (1,2) and Emmanuel Dinnat (1,3). Aquarius Level-3 weekly polar-gridded data sets can be downloaded from the National Snow and Ice Data Center (NSIDC).
Brucker, L., Dinnat, E.P., and Koenig, L.S. (2014b). Weekly Gridded Aquarius L-band Radiometer/Scatterometer Observations and Salinity Retrievals Over the Polar Regions - Part 2: Initial Product Analysis, The Cryosphere, 8, 915-930, doi:10.5194/tc-8-915-2014.
Brucker, L., Dinnat, E.P., Picard, G., and Champollion, N. (2014c). Effect of Snow Surface Metamorphism on Aquarius L-Band Radiometer Observations at Dome C, Antarctica, IEEE Transactions on Geoscience and Remote Sensing, 52 (11), 1-10, doi: 10.1109/TGRS.2014.2312102.
Over the polar region there is a large range of TBs. Where the ocean is not covered by sea ice, TBs are low (about 100 K). In contrast, where the ocean is covered by sea ice higher TBs are measured (about 170 to 270 K). The temporal and spatial distribution of the TBs over sea ice depends on the sea ice properties (e.g., concentration, thickness). Measurements over the Greenland and Antarctic ice sheets also vary according to the snow and ice properties (e.g. temperature, accumulation, presence of melting snow) but they are more stable than over sea ice, which drifts with the oceanic currents.
Scientists studying the Earth's cryosphere (e.g., ice sheet, sea ice, and permafrost) are motivated to use the Aquarius TB measurements because they contain new information about snow and ice properties. Over the ice sheets, Aquarius' measurements can provide us with information from hundreds of meters below the surface, hence centuries old ice in some places. Understanding these data could lead to new cryospheric applications such as the monitoring of long-term ice temperature changes, and snow accumulation over the ice sheets. Similar new applications exist for sea ice, and permafrost.
The data presented are a weekly gridded average of the swath data distributed by NASA's Physical Oceanography Distributed Active Archive Center (PO.DAAC) and provided by Ludovic Brucker (1,2) and Emmanuel Dinnat (1,3). Aquarius Level-3 weekly polar-gridded data sets can be downloaded from the National Snow and Ice Data Center (NSIDC).
(1) NASA Goddard Space Flight Center, Cryospheric Sciences Lab, Greenbelt MD, USA
(2) Universities Space Research Association, Greenbelt MD, USA
(3) Chapman University, Orange CA, USA
(2) Universities Space Research Association, Greenbelt MD, USA
(3) Chapman University, Orange CA, USA
Aquarius Retrieved Brightness Temperature in the Northern High-Latitude Ocean
In the Northern Hemisphere, the sea-ice cover typically reaches a maximum extent in March, and a minimum extent in September.
Beginning in June and extending through the months of July, August, and September, there are large areas of the central Arctic
that have ice-free waters (blue color on the map). In October, there is an increase in the extent of the sea-ice cover, and this
increase continues until the following March (red color replacing blue and green colors on the map).2013 Maps: Northern Hemisphere | ||||||
 December 26, 2013 |  December 19, 2013 | 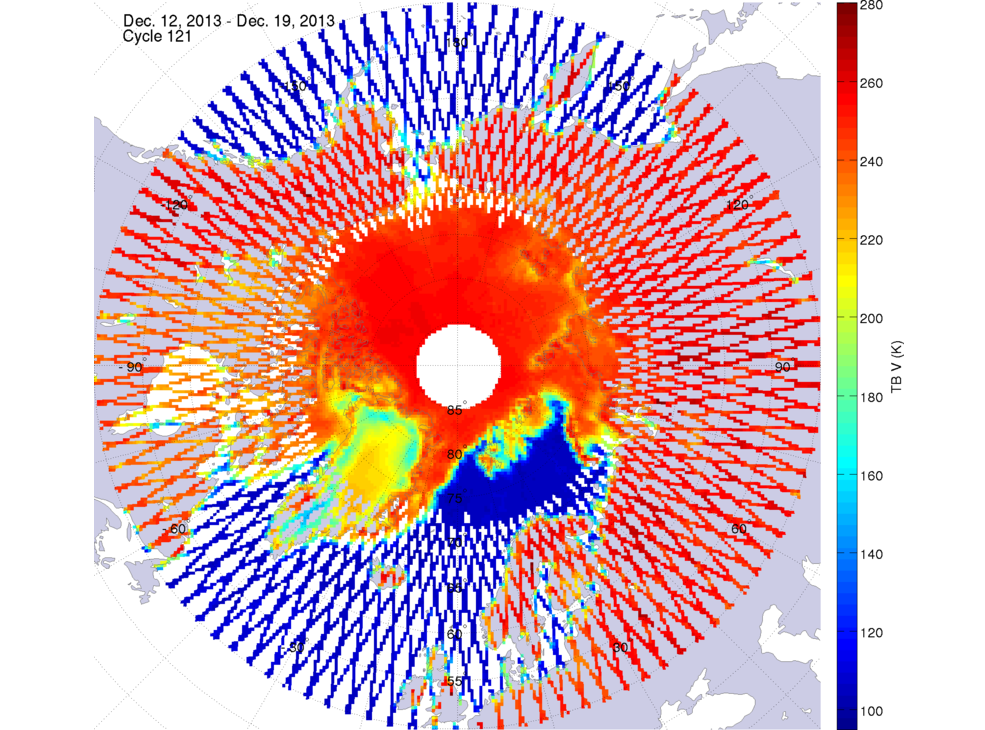 December 12, 2013 |  December 5, 2013 | |||
 November 28, 2013 |  November 21, 2013 |  November 14, 2013 |  November 7, 2013 | |||
 October 31, 2013 |  October 24, 2013 | 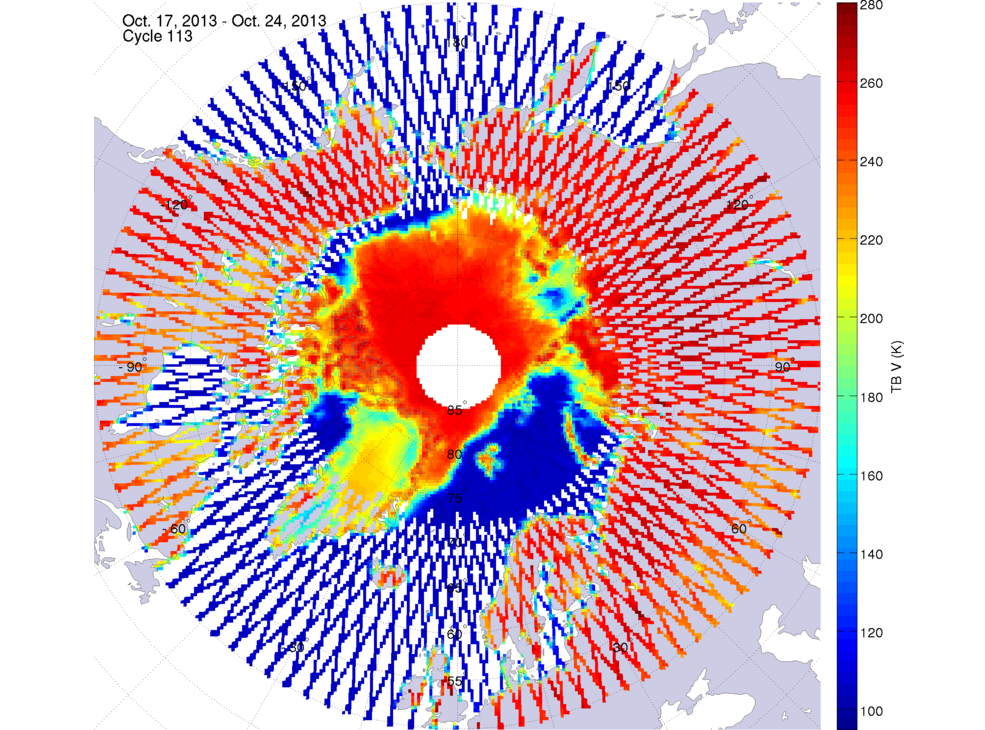 October 17, 2013 | 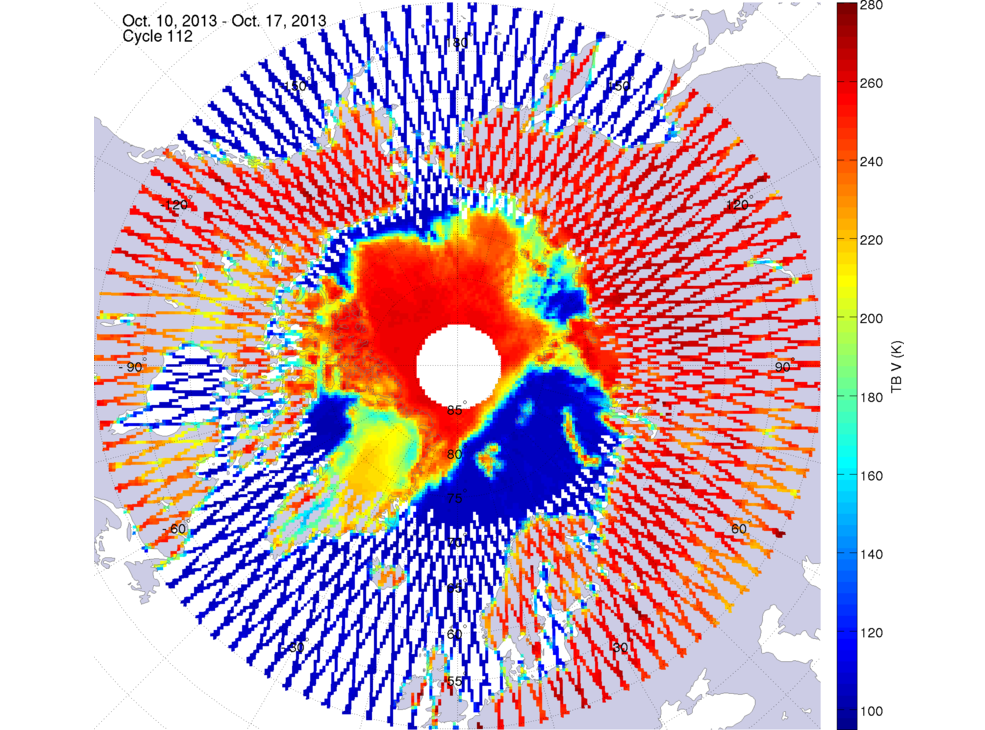 October 10, 2013 | |||
 October 3, 2013 | 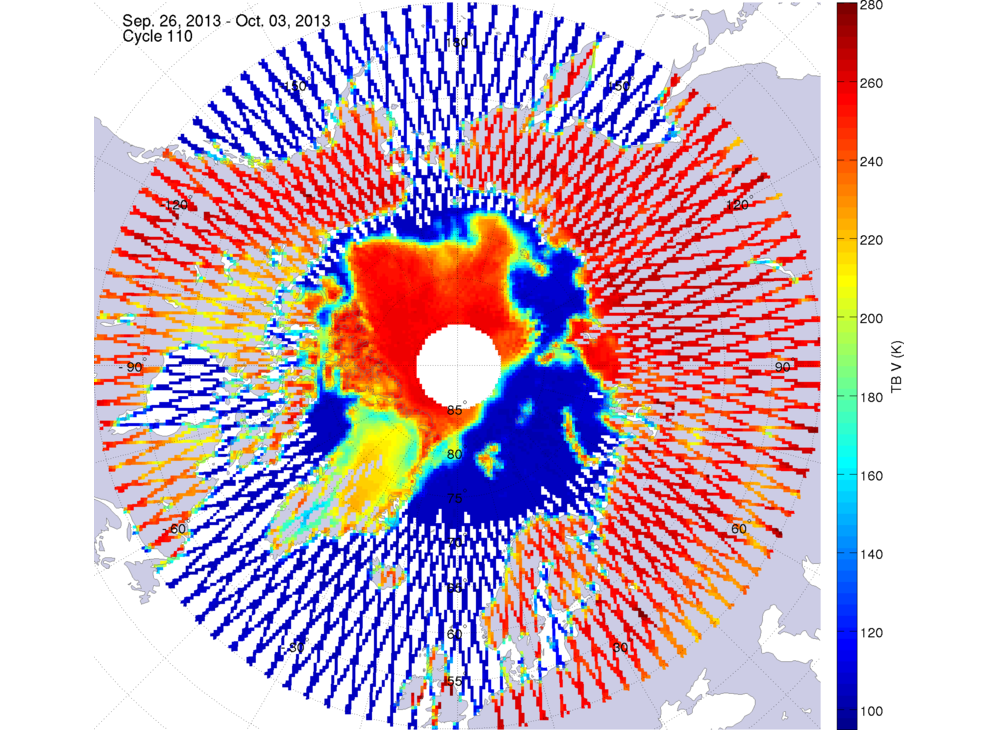 September 26, 2013 | 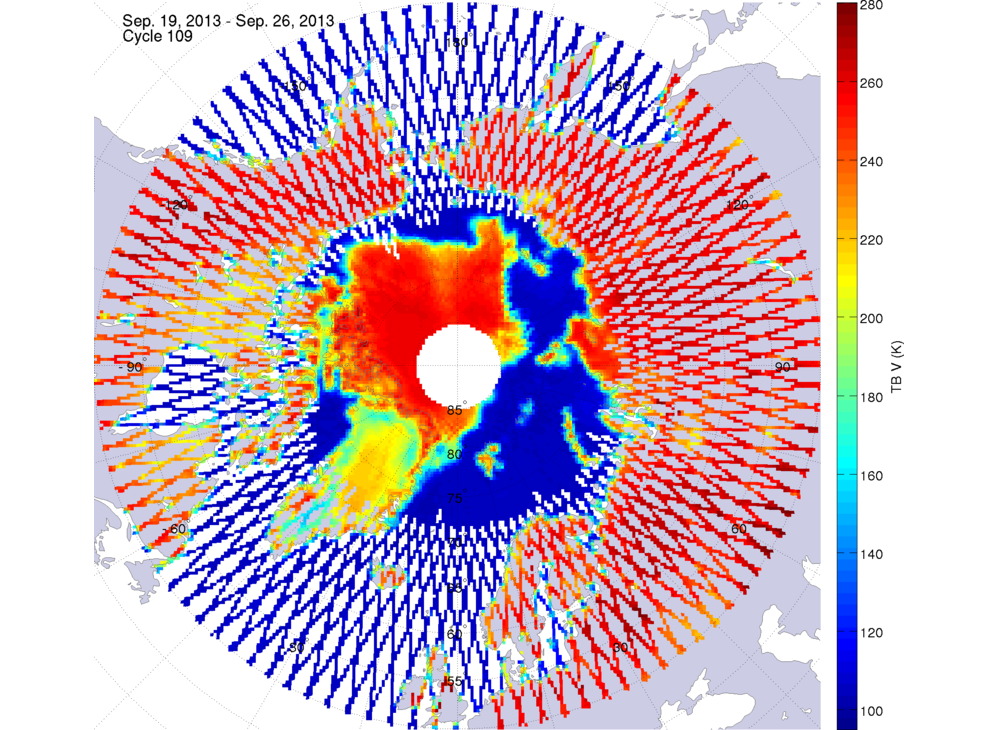 September 19, 2013 |  September 12, 2013 | |||
 September 5, 2013 |  August 29, 2013 | 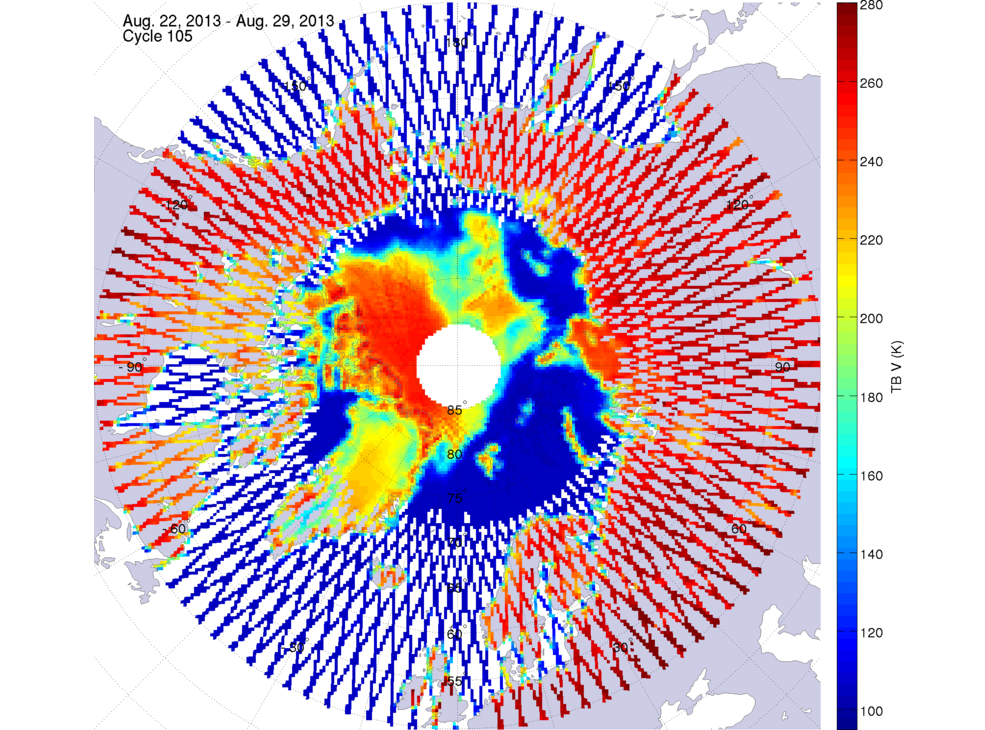 August 22, 2013 |  August 15, 2013 | |||
 August 8, 2013 | 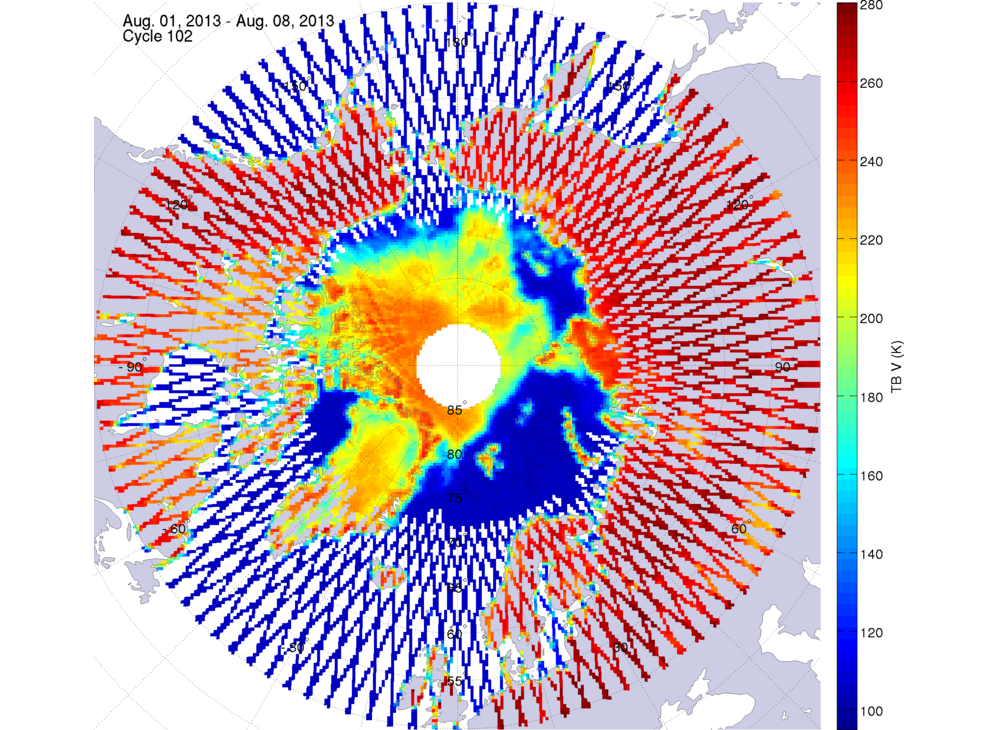 August 1, 2013 | 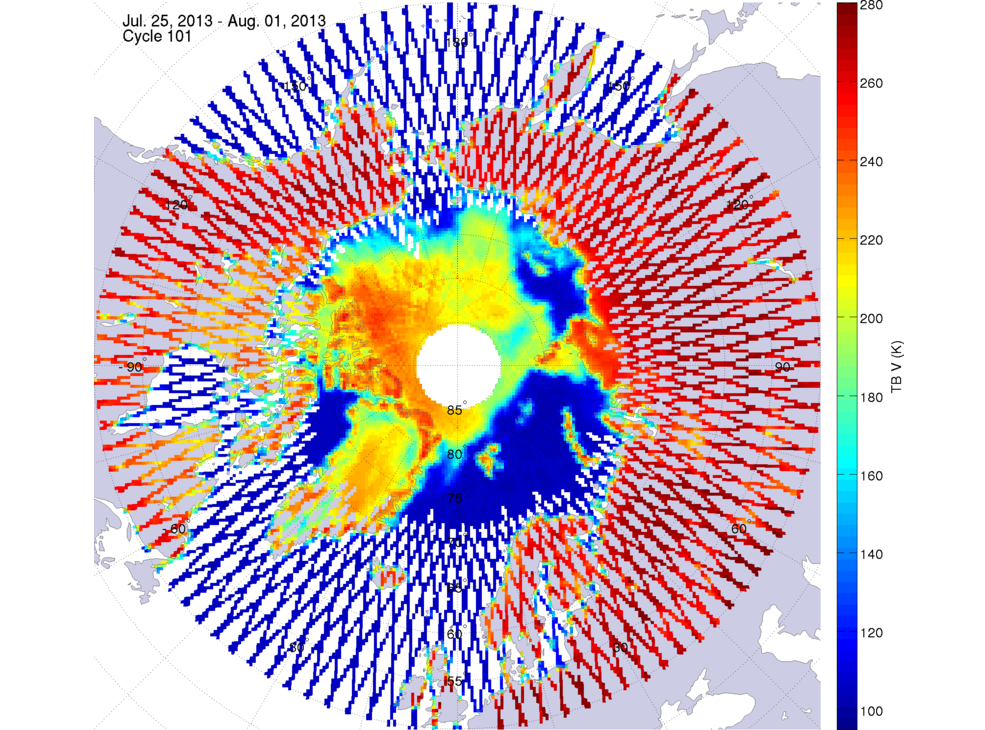 July 25, 2013 |  July 18, 2013 | |||
 July 11, 2013 | 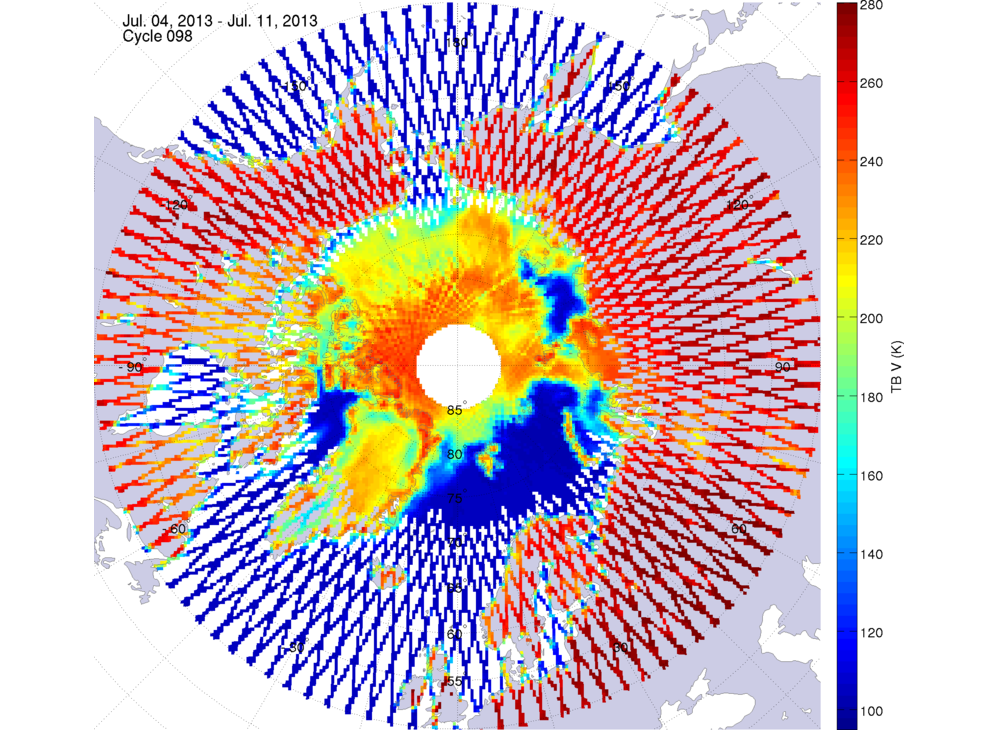 July 4, 2013 |  June 27, 2013 | 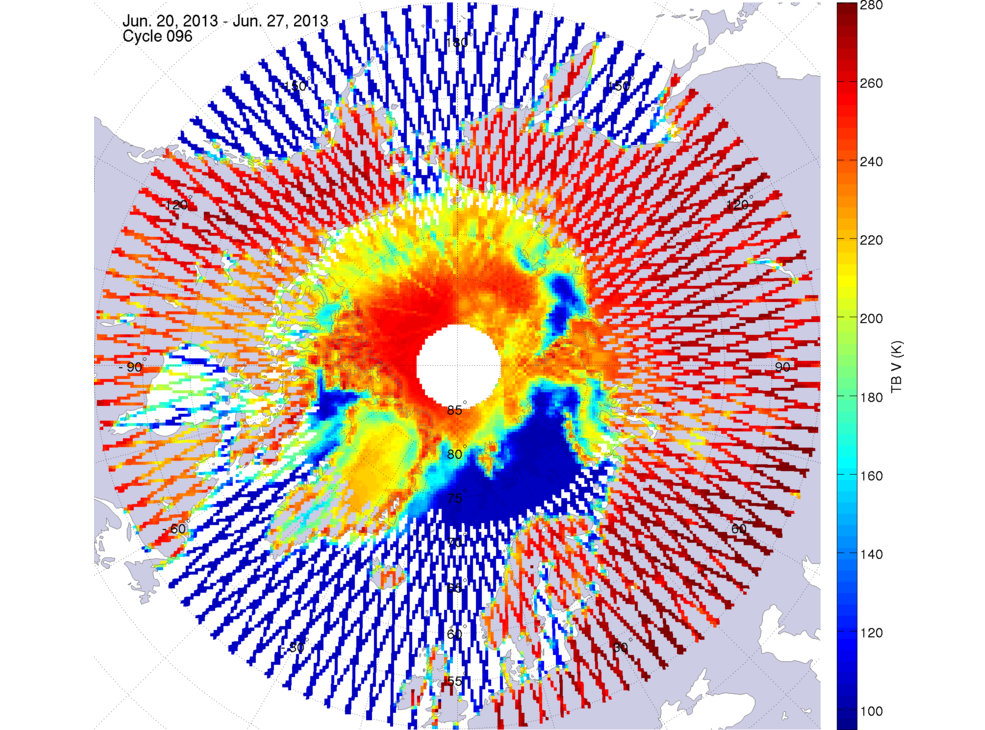 June 20, 2013 | |||
 June 13, 2013 |  June 6, 2013 |  May 30, 2013 | 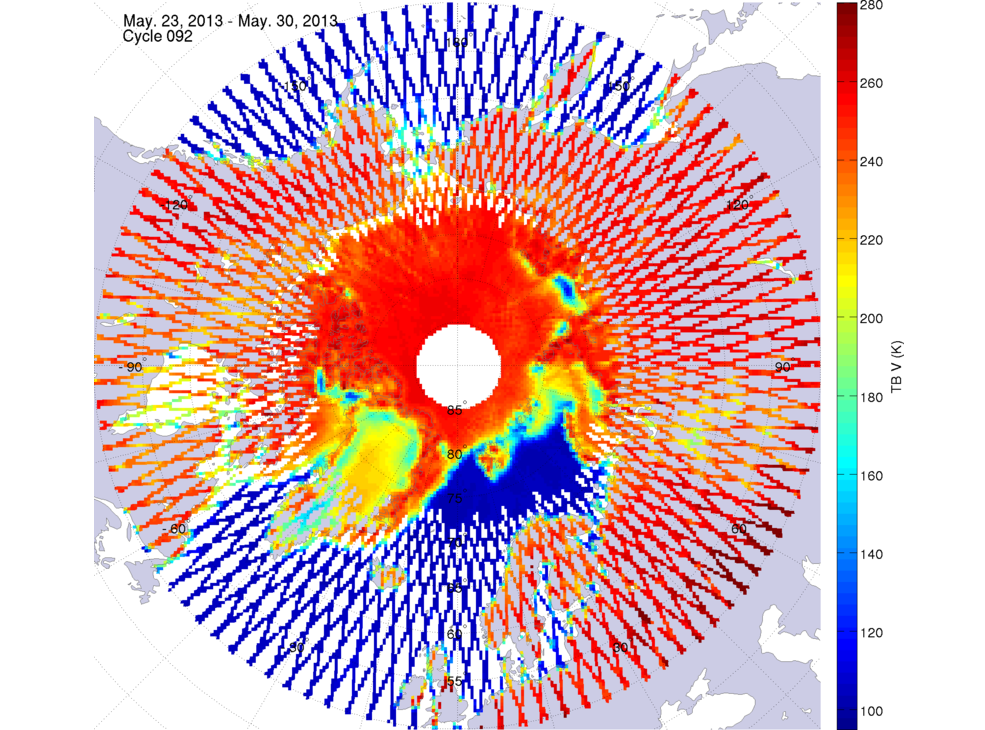 May 23, 2013 | |||
 May 16, 2013 | 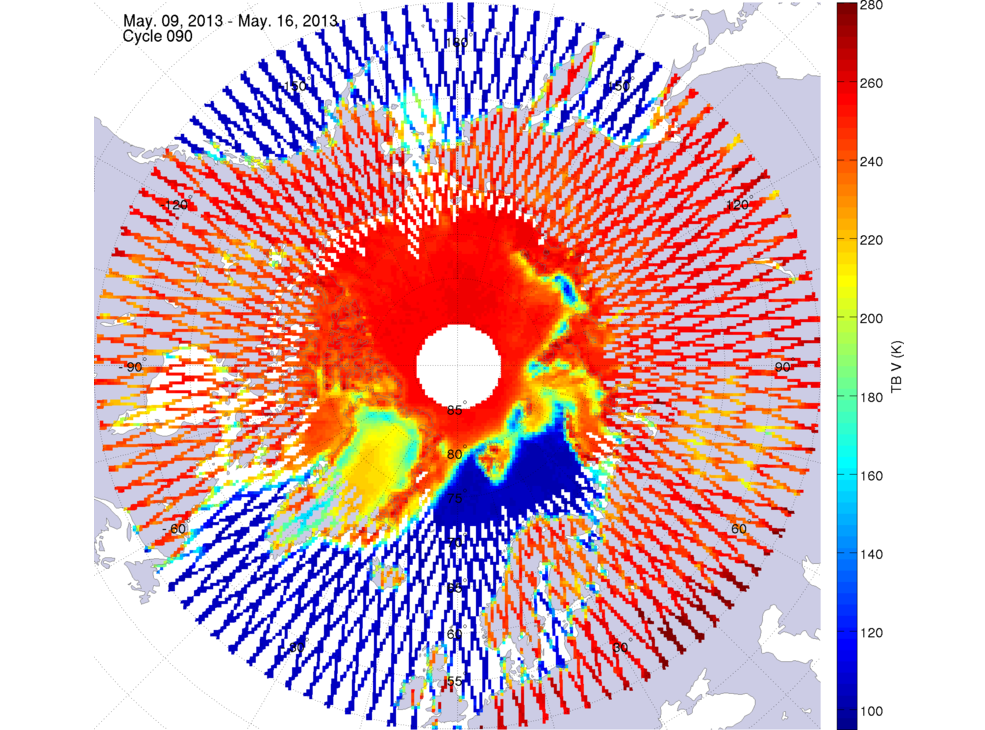 May 9, 2013 | 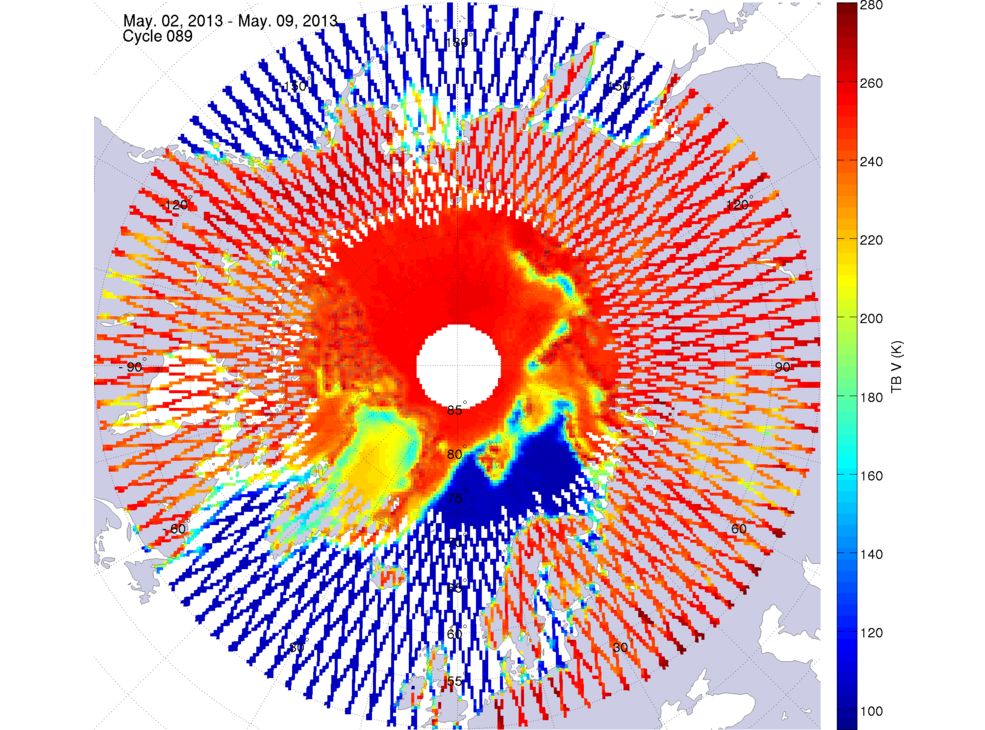 May 2, 2013 | 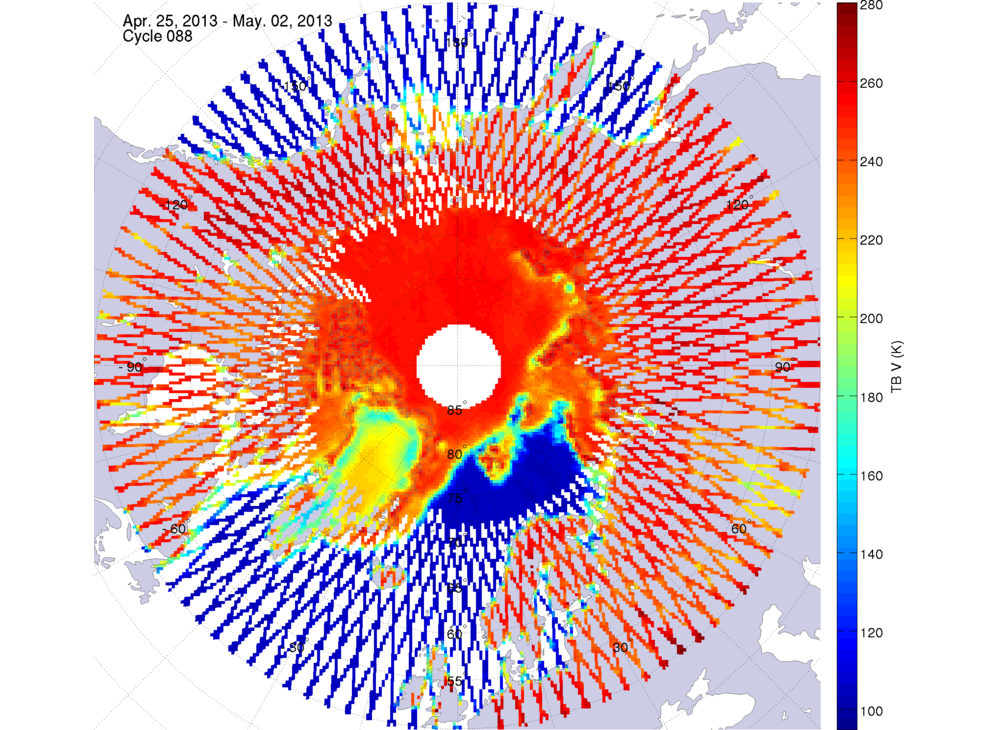 April 25, 2013 | |||
 April 18, 2013 | 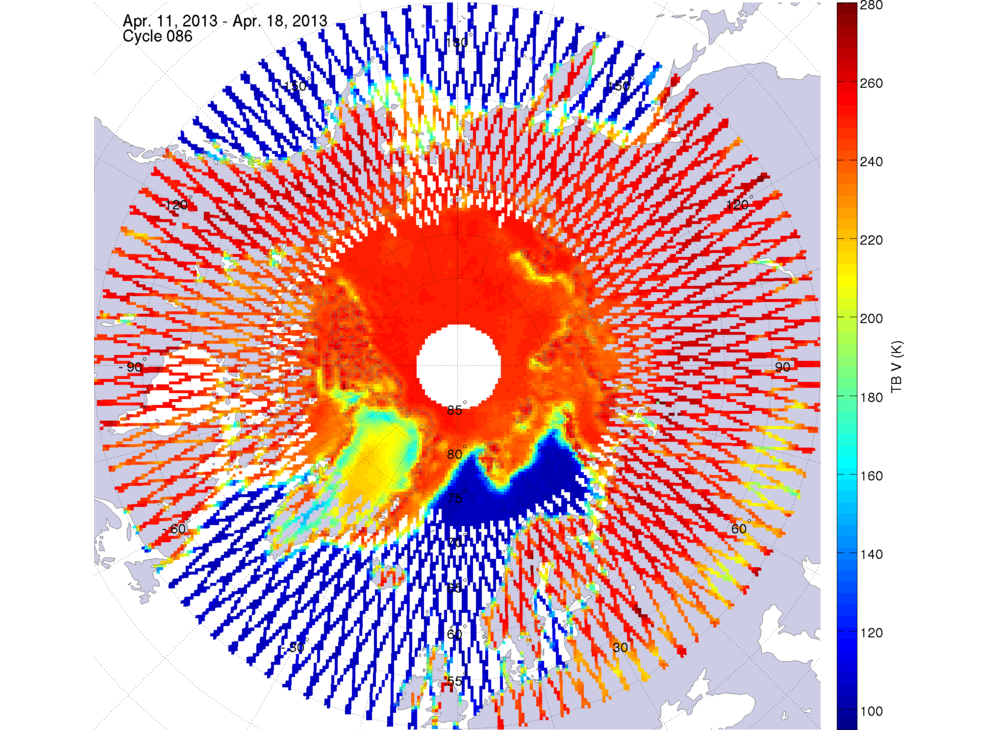 April 11, 2013 | 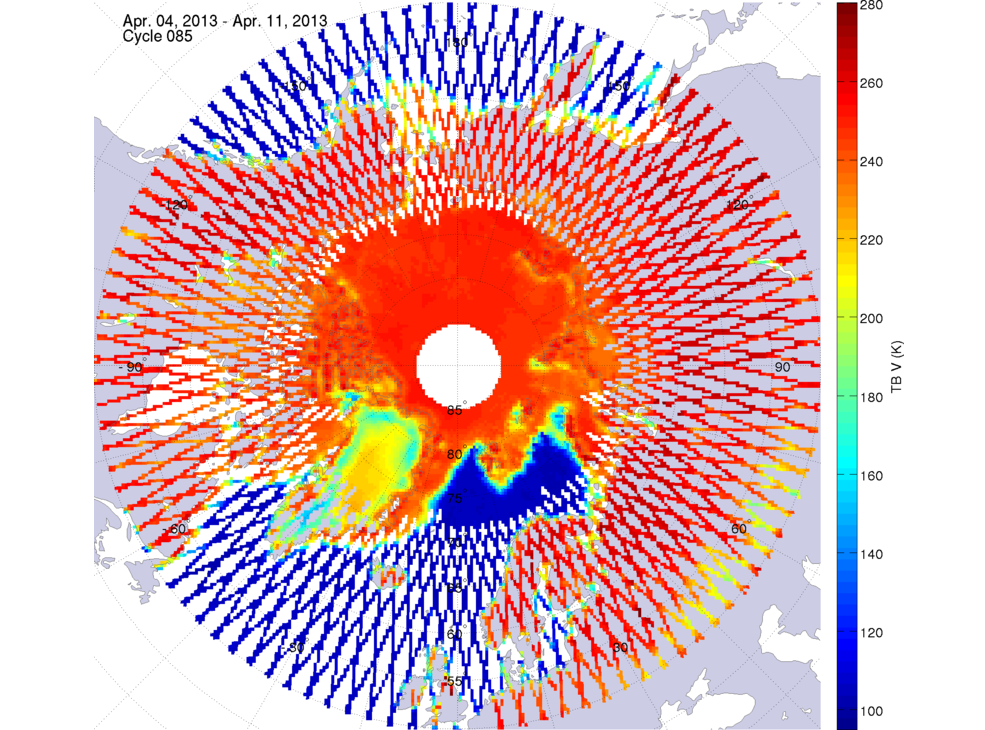 April 4, 2013 | 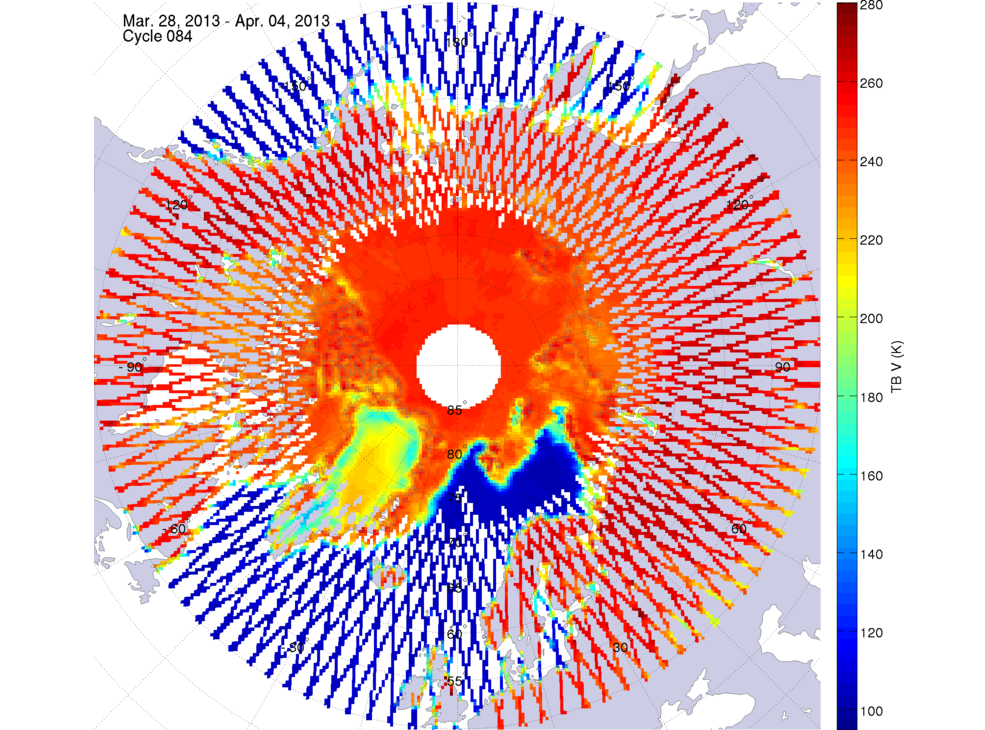 March 28, 2013 | |||
 March 21, 2013 | 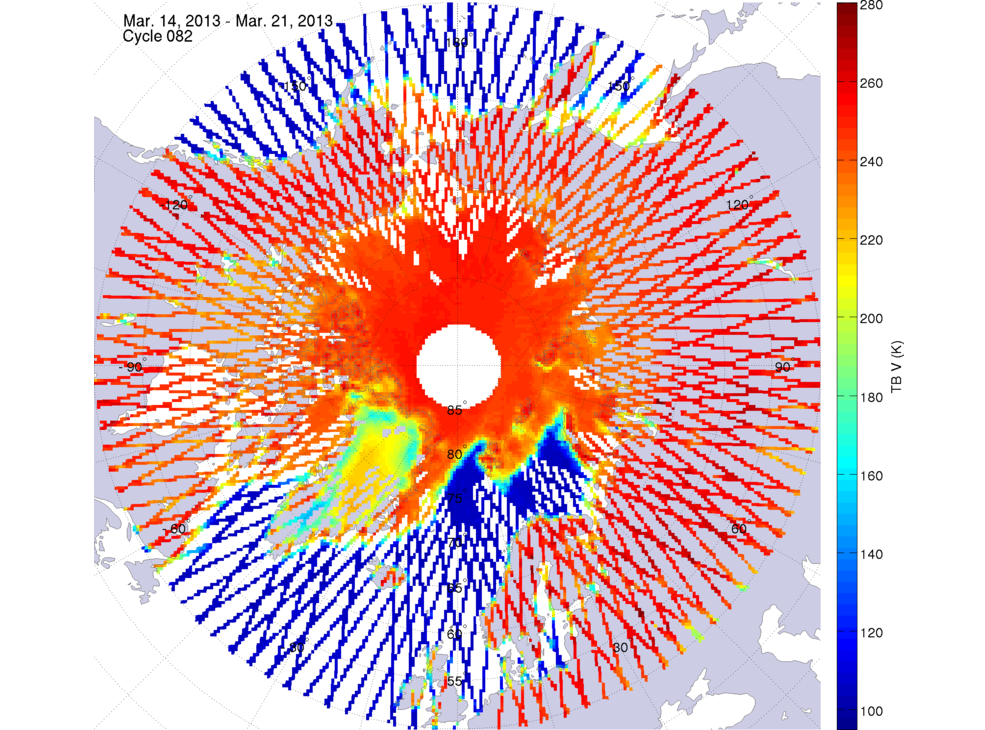 March 14, 2013 |  March 7, 2013 | 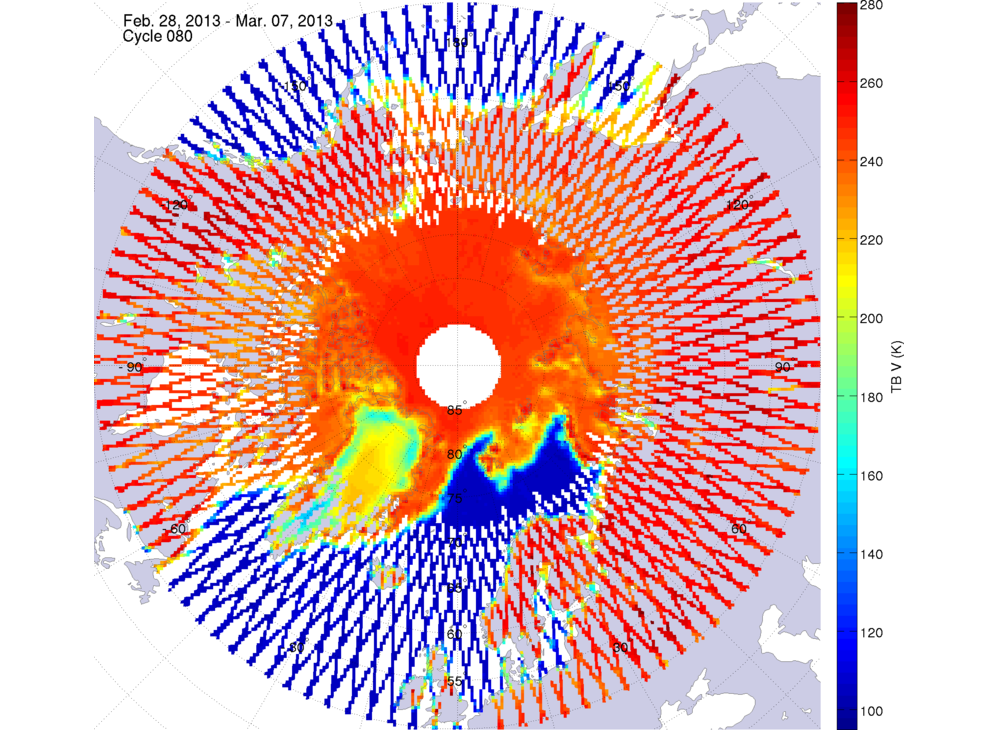 February 28, 2013 | |||
 February 21, 2013 | 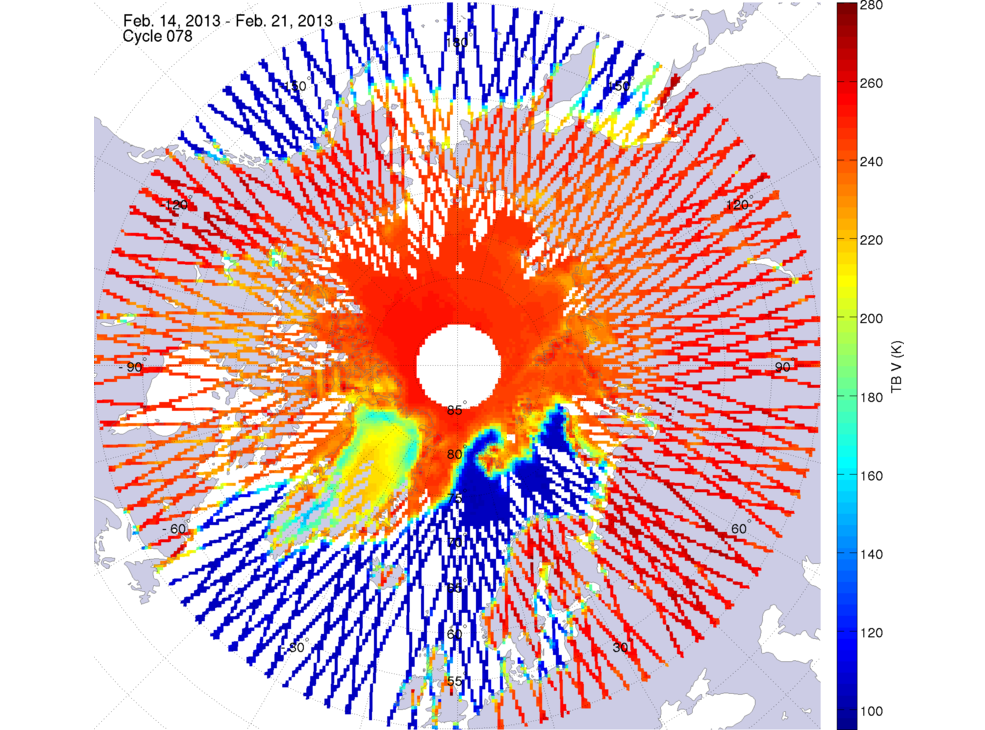 February 14, 2013 | 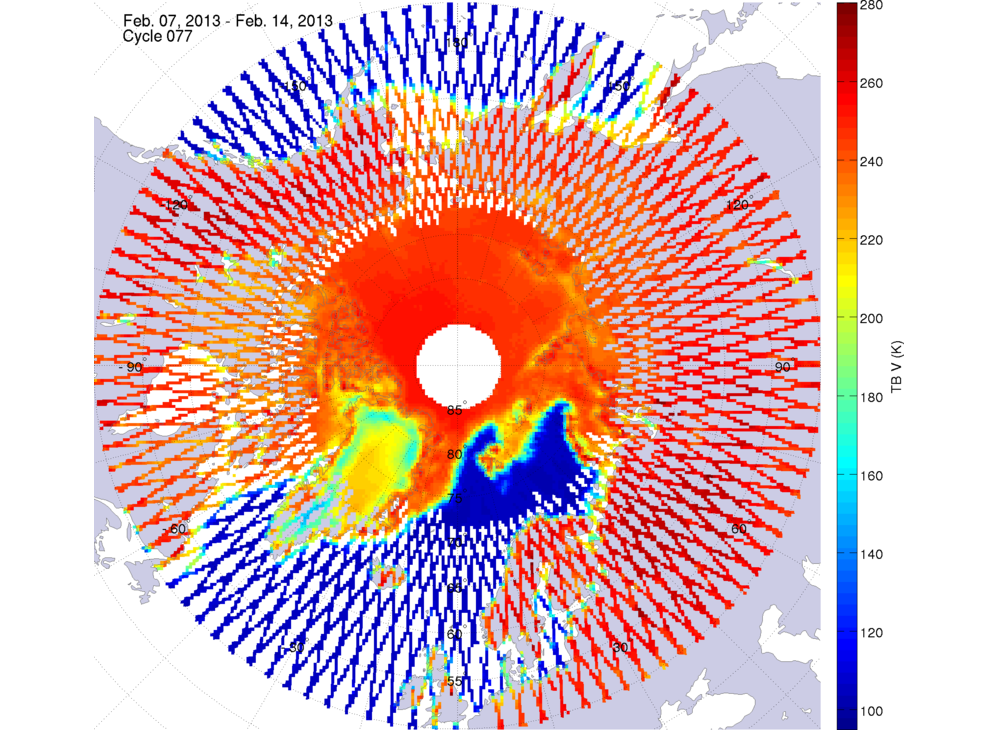 February 7, 2013 | 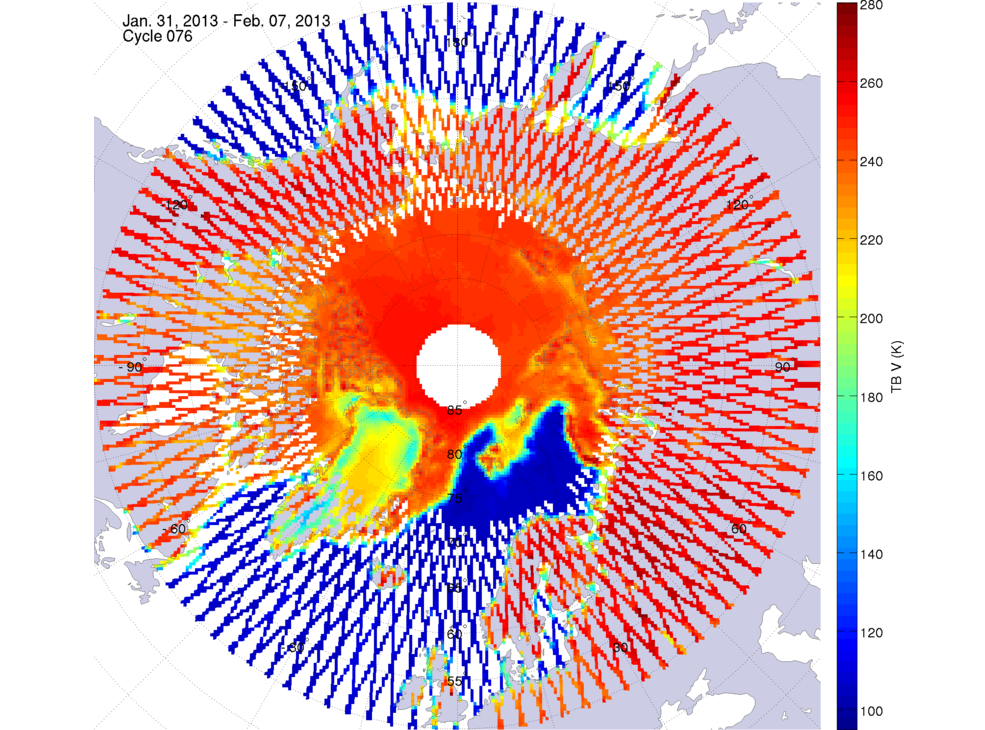 January 31, 2013 | |||
 January 24, 2013 | 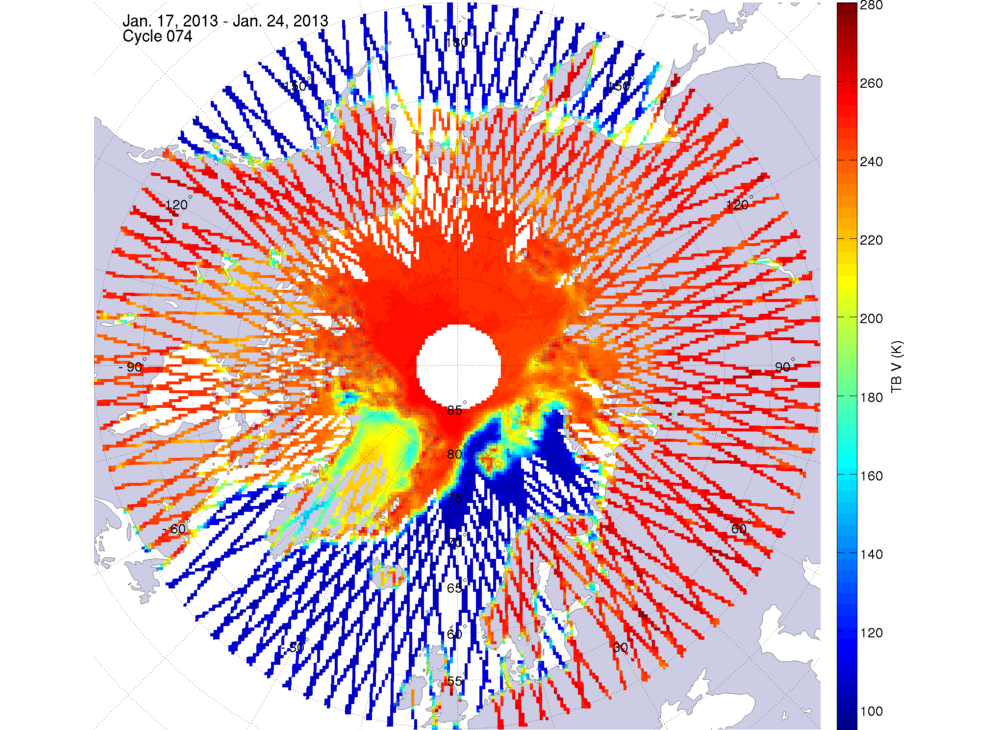 January 17, 2013 | 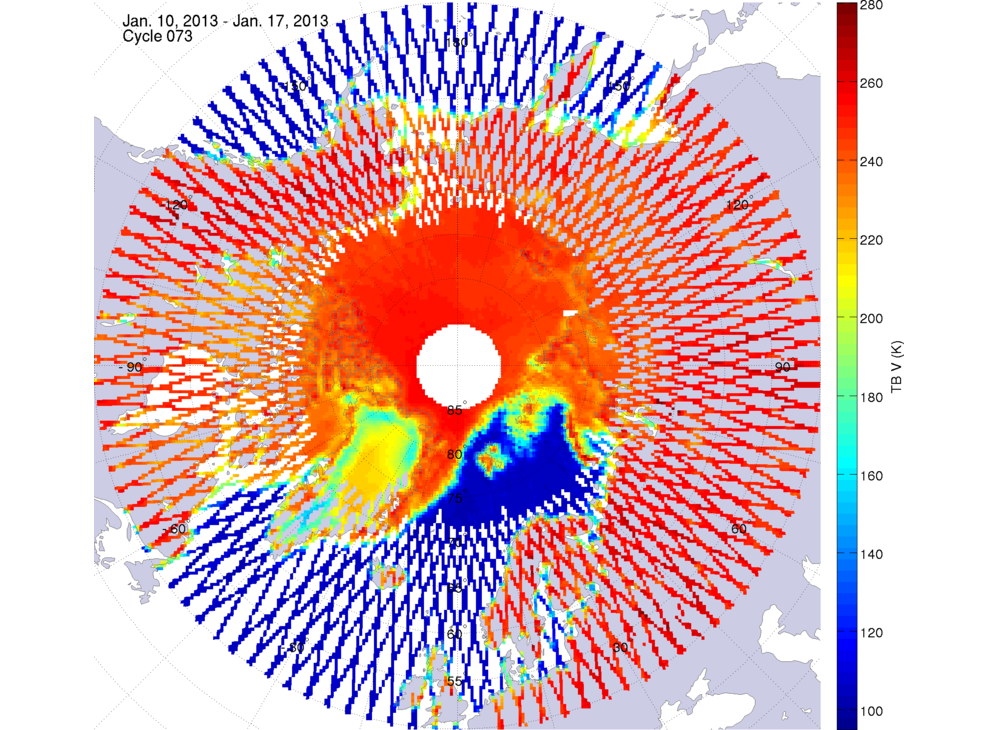 January 10, 2013 |  January 3, 2013 | |||
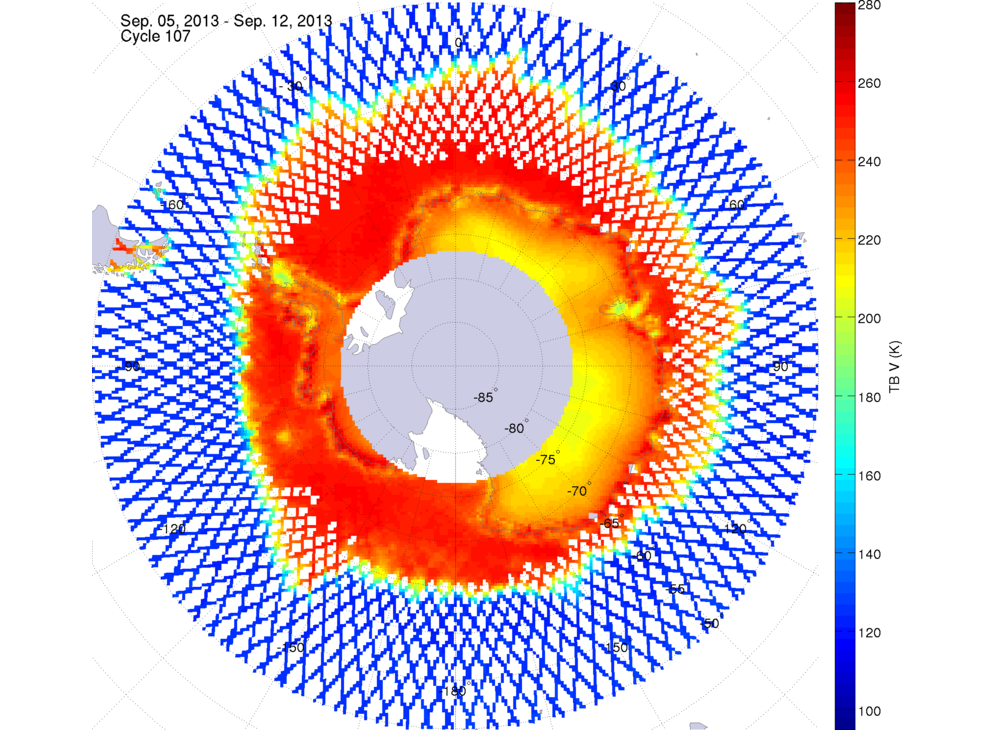
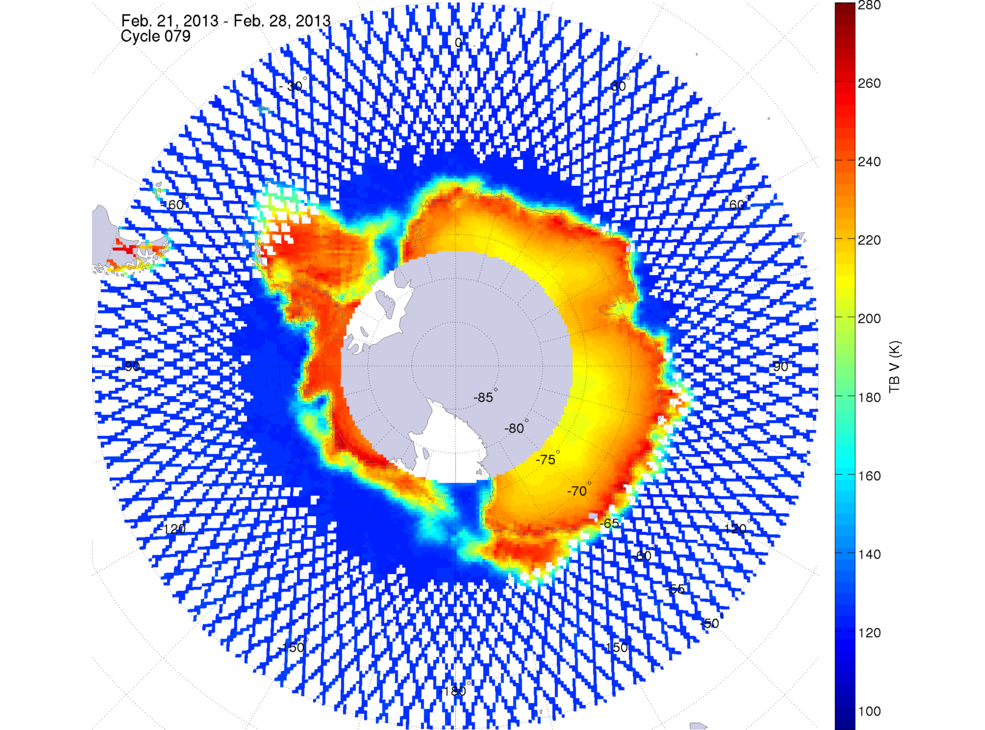
Aquarius Retrieved Brightness Temperature in the Southern High-Latitude Ocean
In the Southern Hemisphere, the month of minimum sea ice extent is February, whereas the month of maximum extent is October. In
general, the Antarctic sea-ice cover exhibits faster seasonal ice extent variations than that monitored in the Northern
Hemisphere.2013 Maps: Southern Hemisphere | ||||||
 December 26, 2013 | 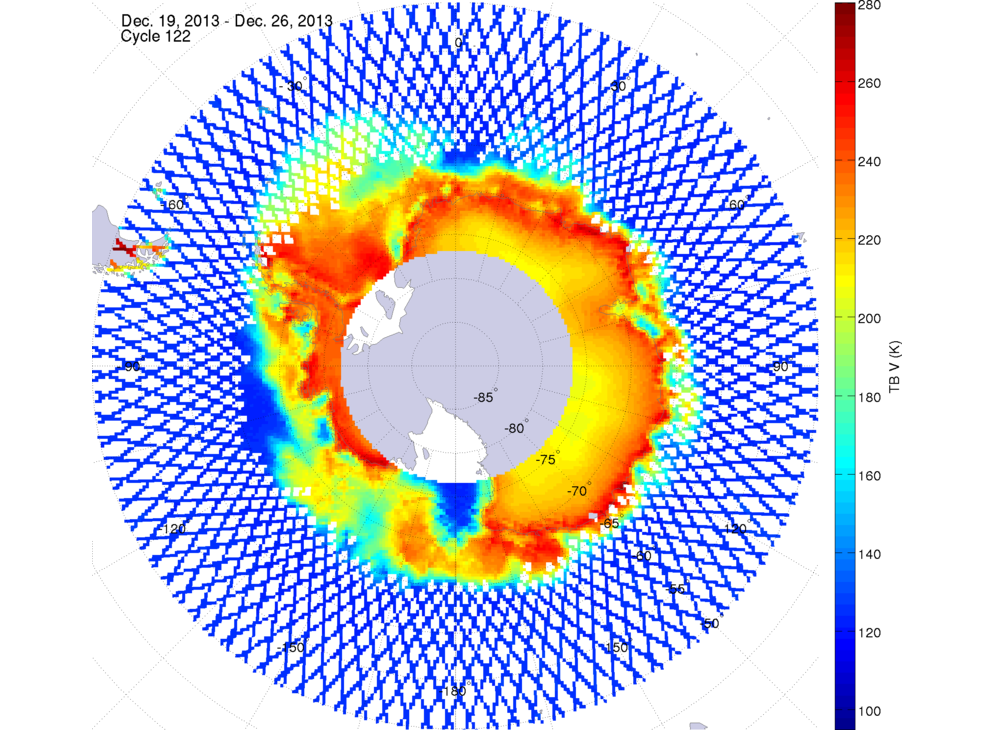 December 19, 2013 | 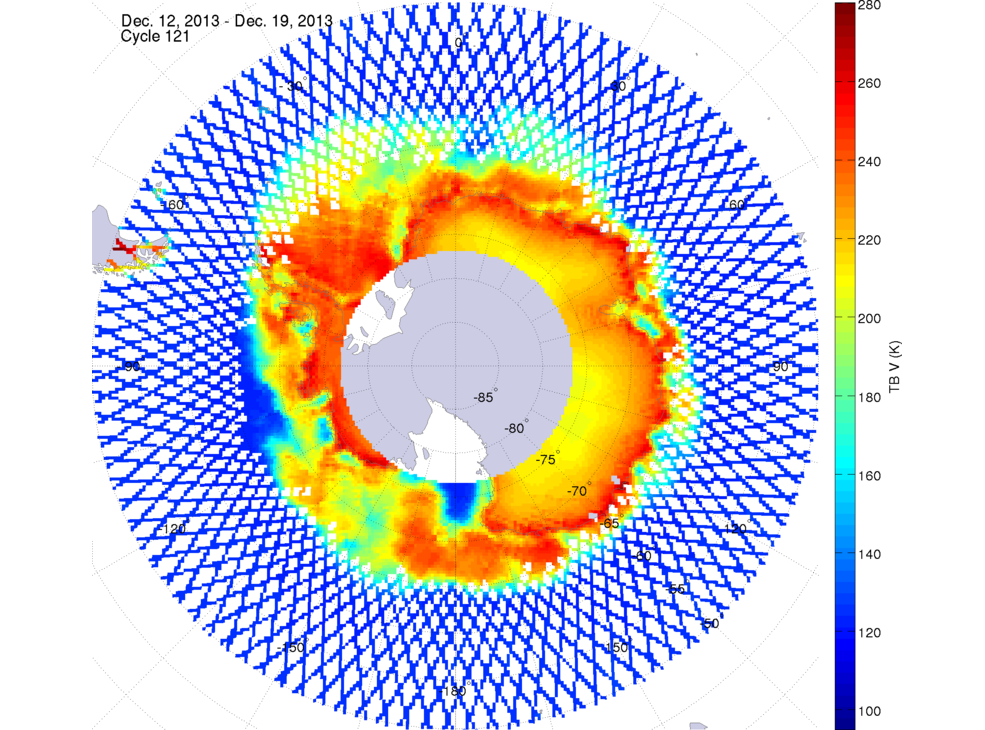 December 12, 2013 |  December 5, 2013 | |||
 November 28, 2013 | 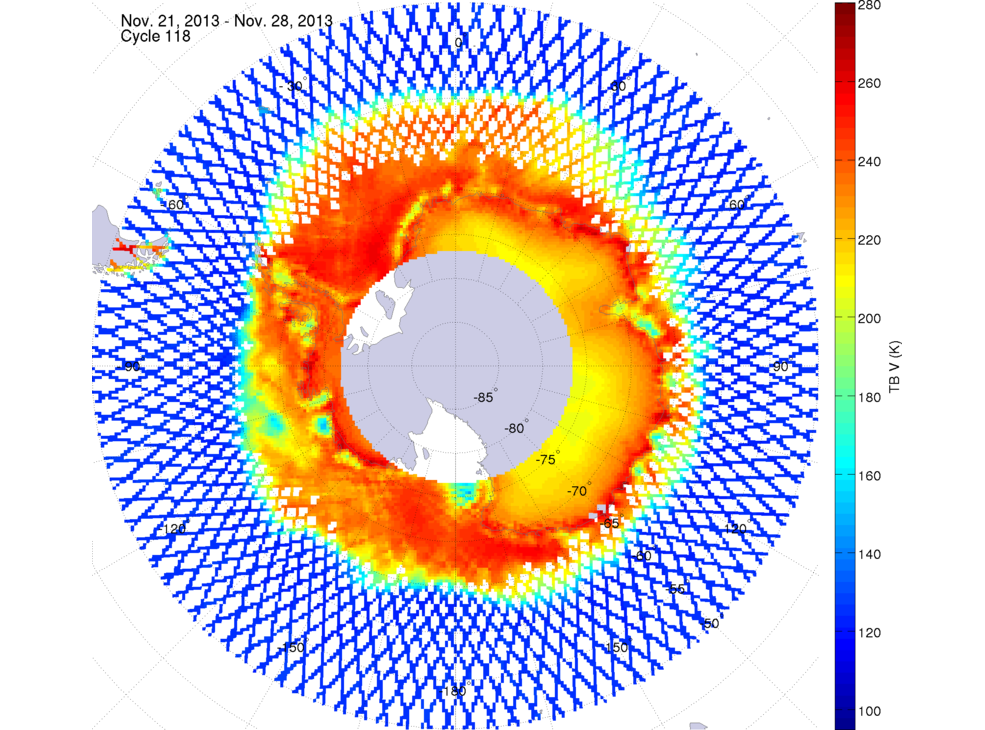 November 21, 2013 | 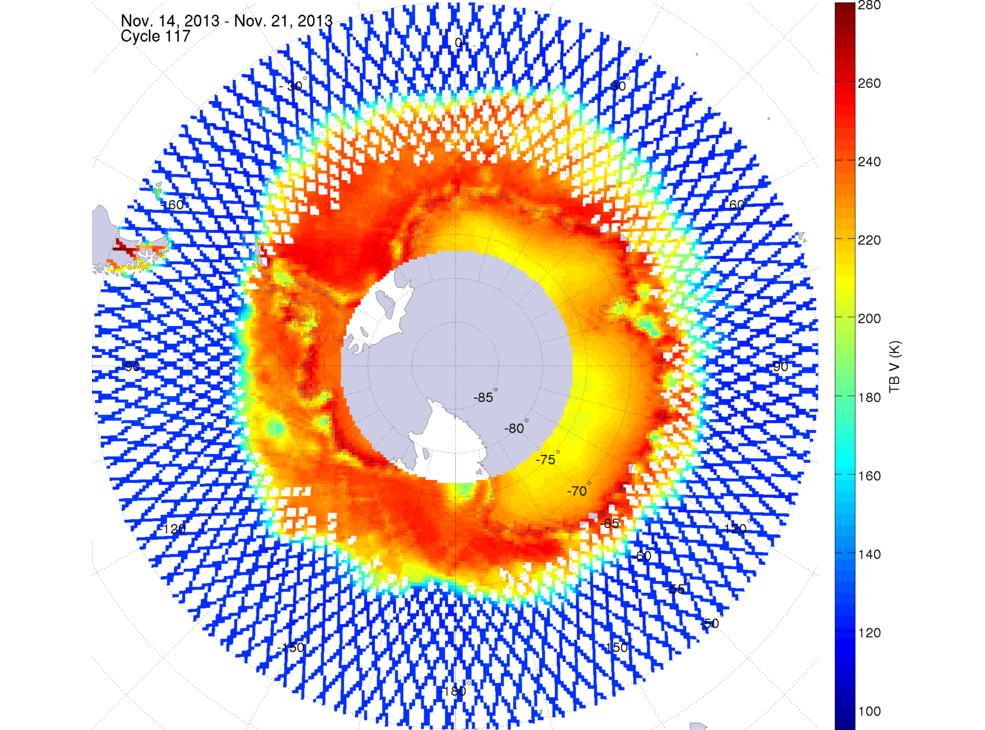 November 14, 2013 | 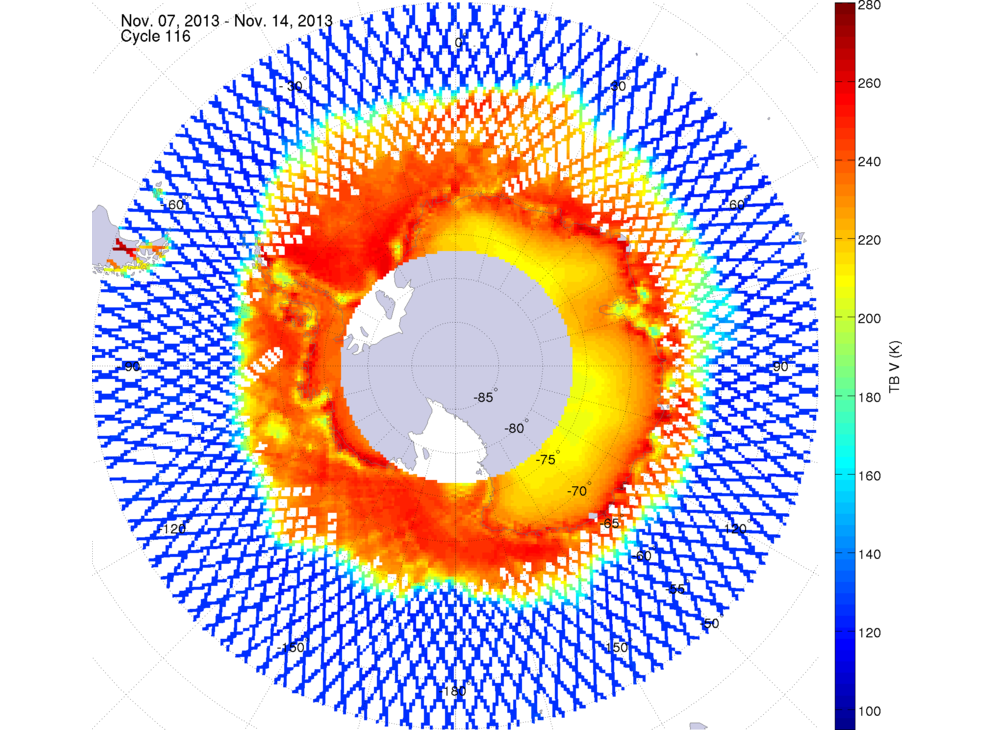 November 7, 2013 | |||
 October 31, 2013 | 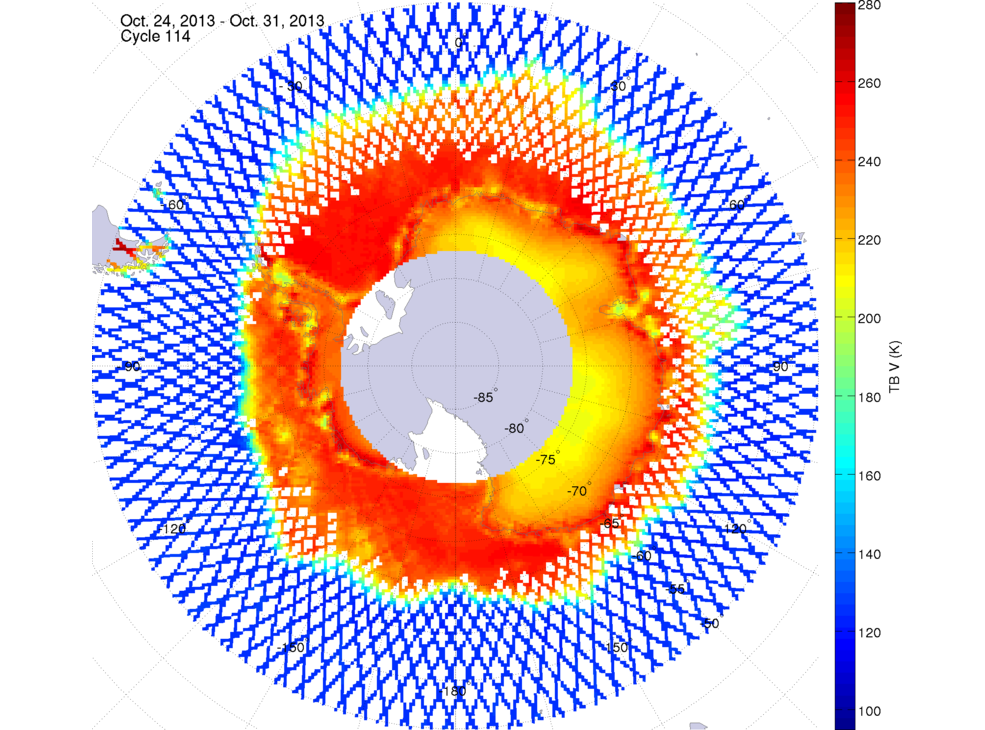 October 24, 2013 | 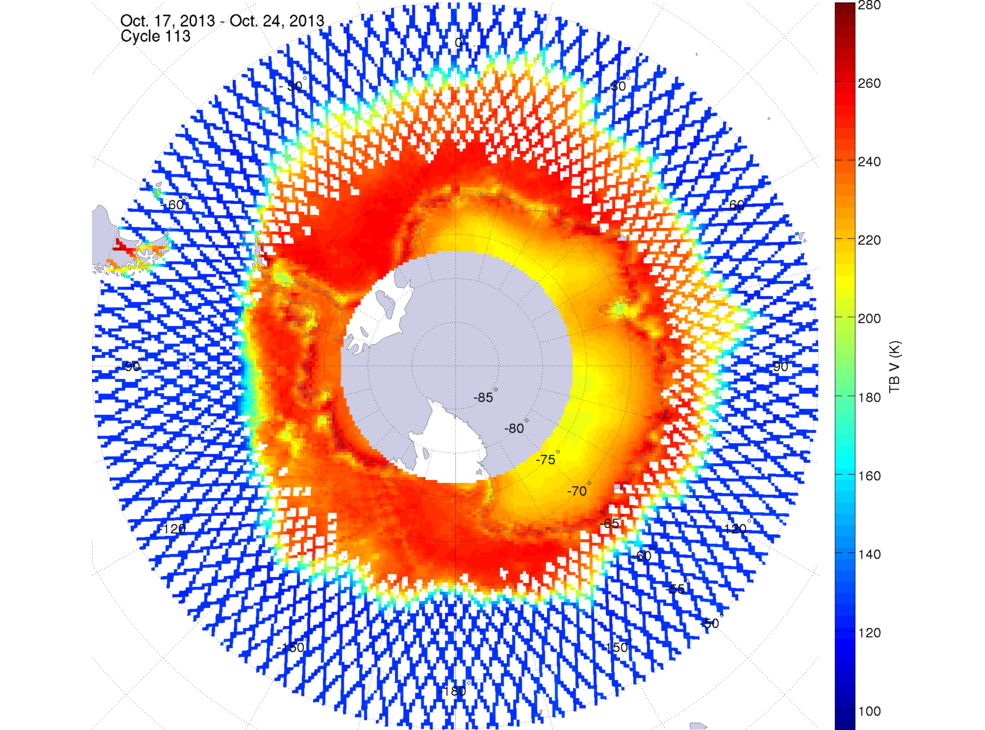 October 17, 2013 | 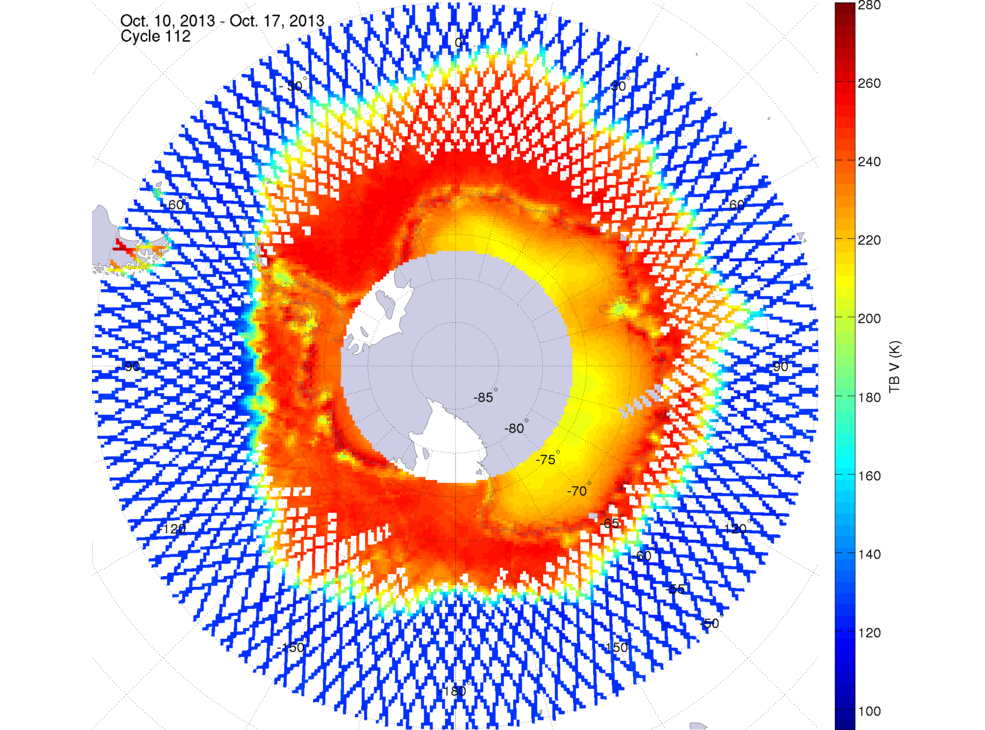 October 10, 2013 | |||
 October 3, 2013 | 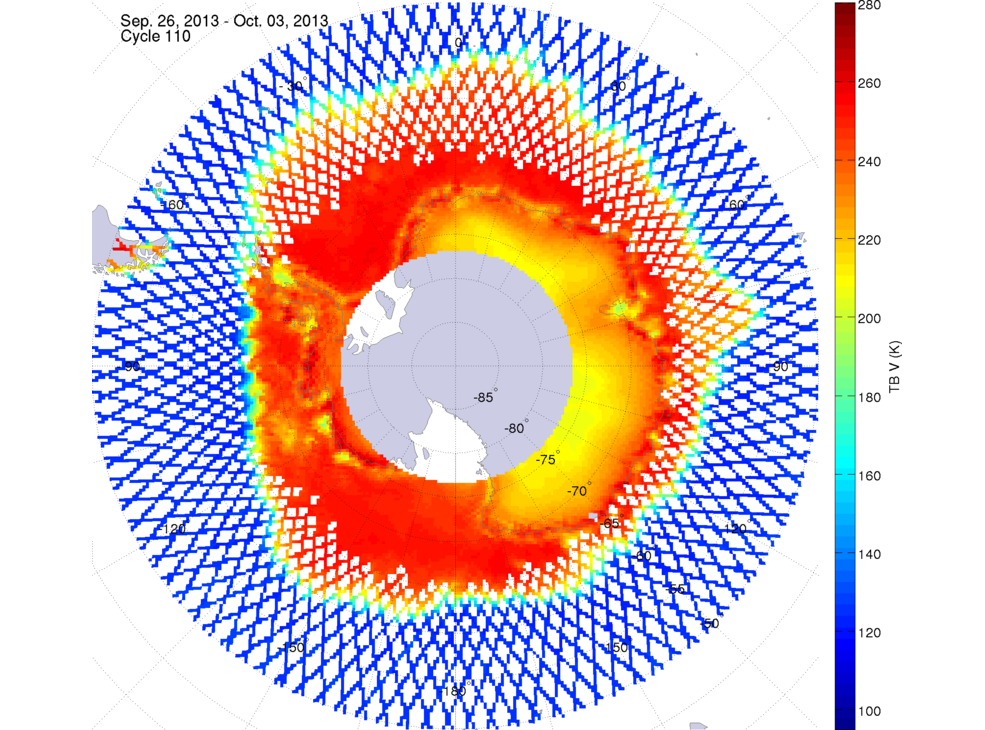 September 26, 2013 | 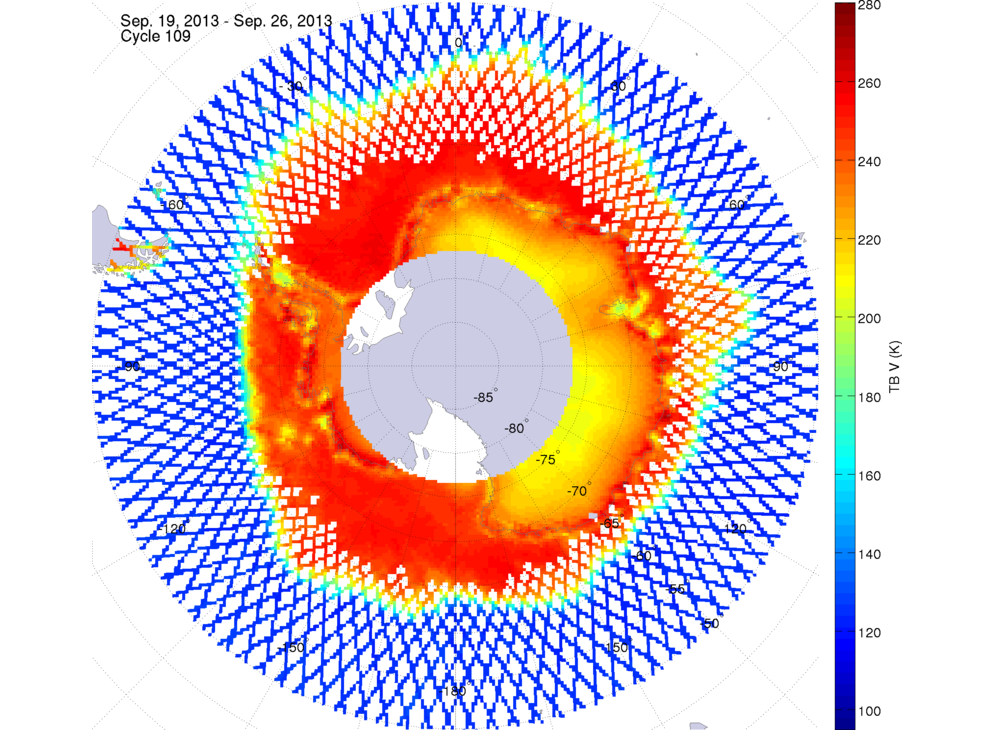 September 19, 2013 |  September 12, 2013 | |||
 September 5, 2013 | 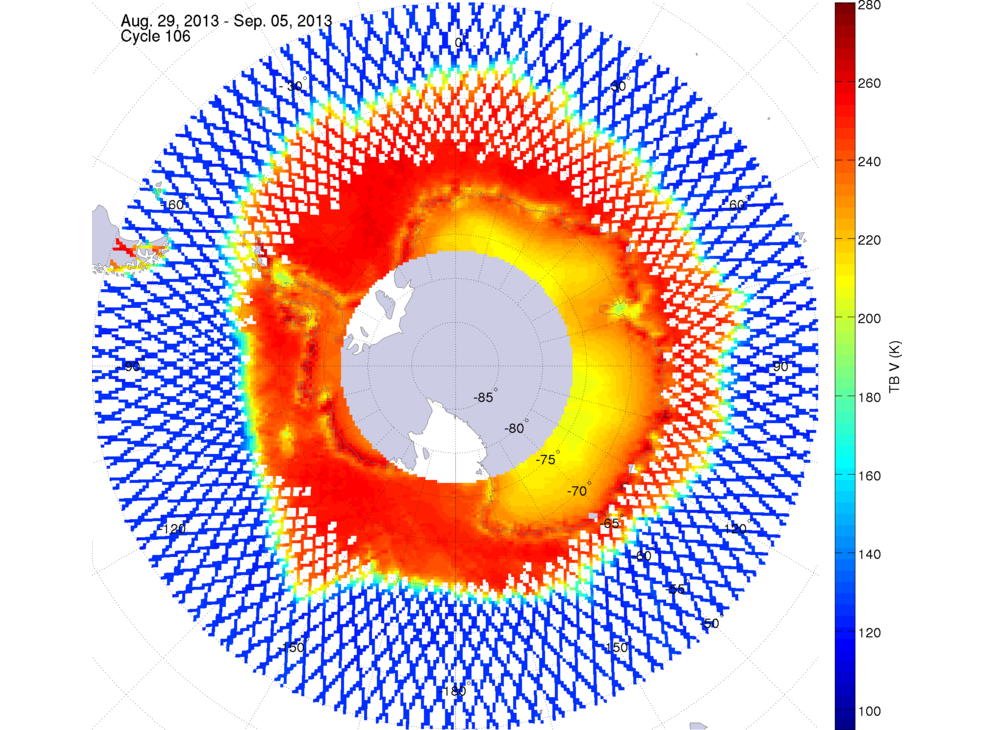 August 29, 2013 | 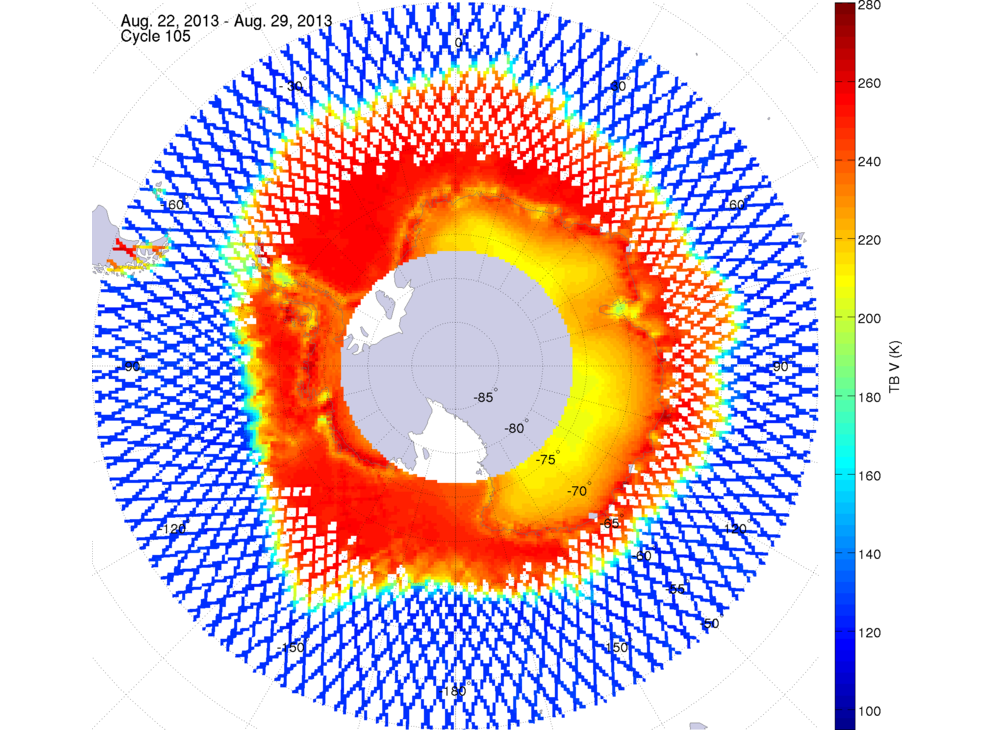 August 22, 2013 | 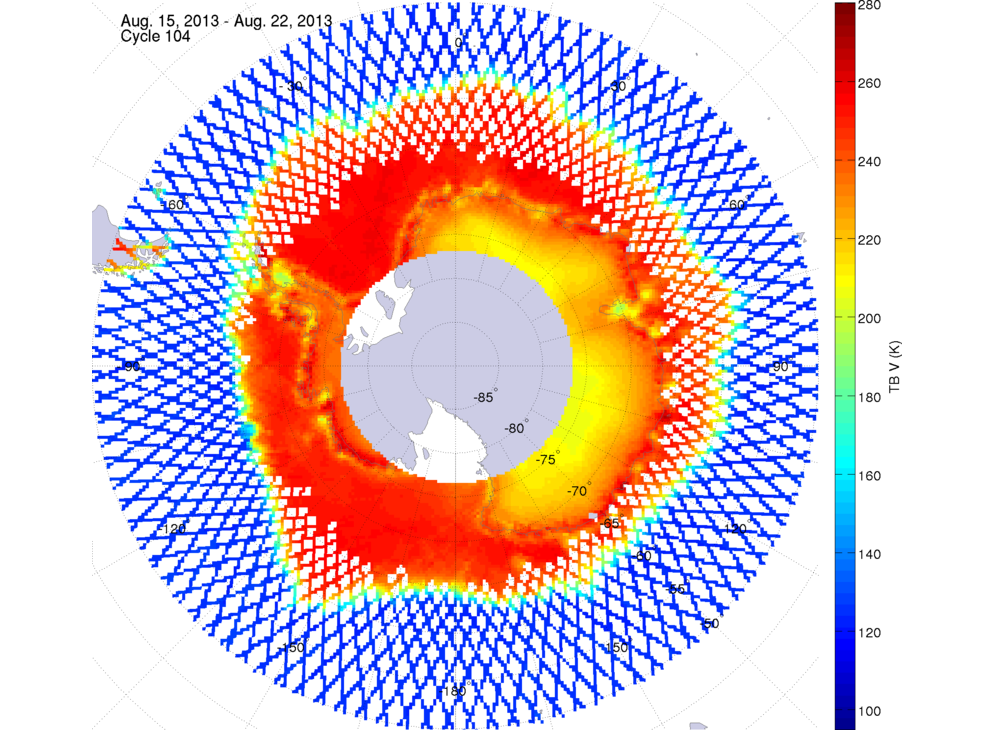 August 15, 2013 | |||
 August 8, 2013 |  August 1, 2013 | 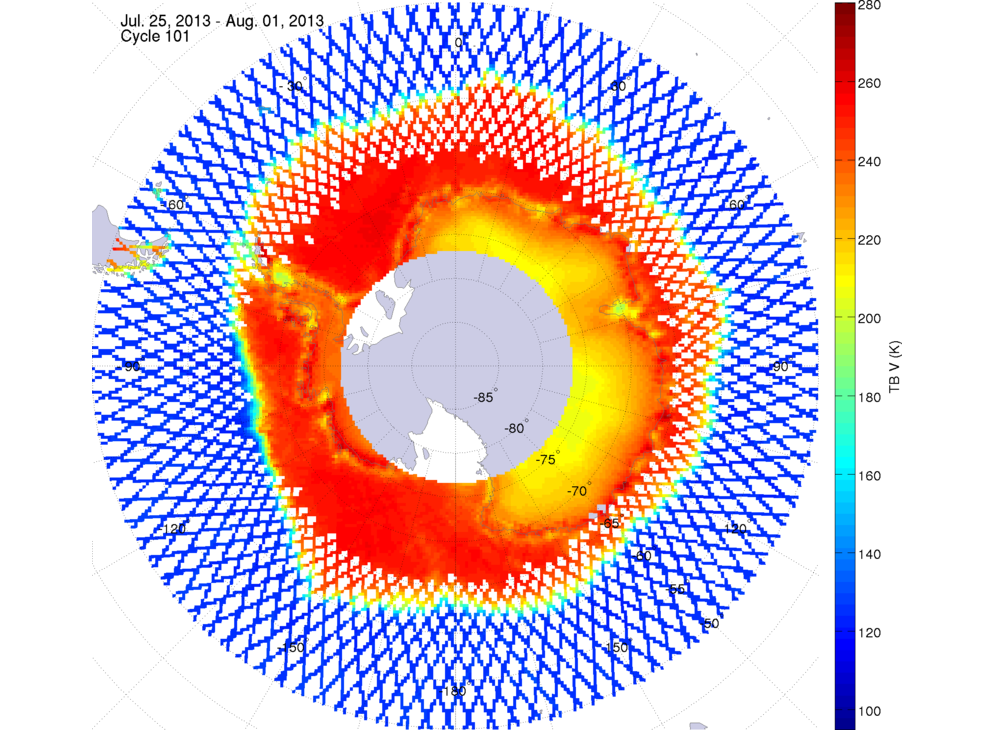 July 25, 2013 | 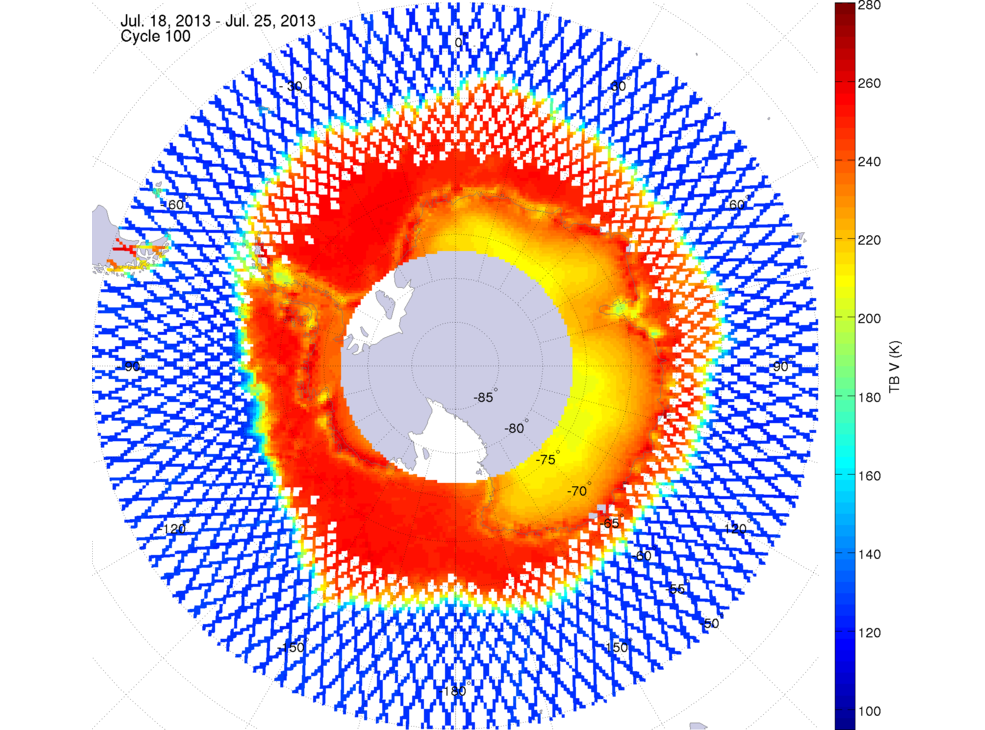 July 18, 2013 | |||
 July 11, 2013 | 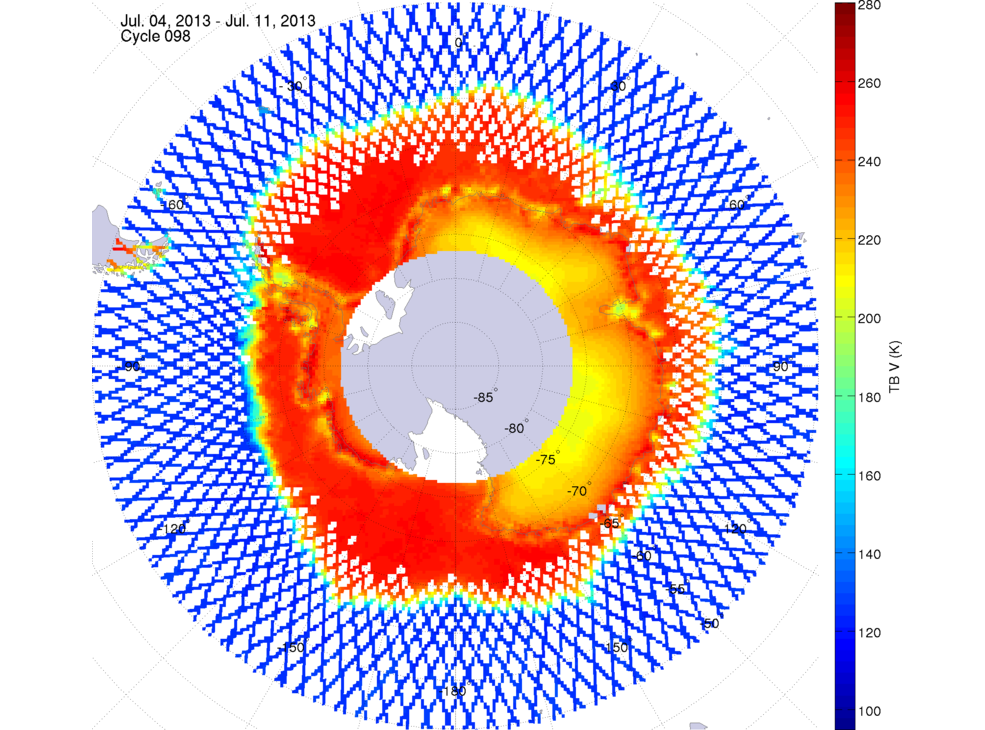 July 4, 2013 | 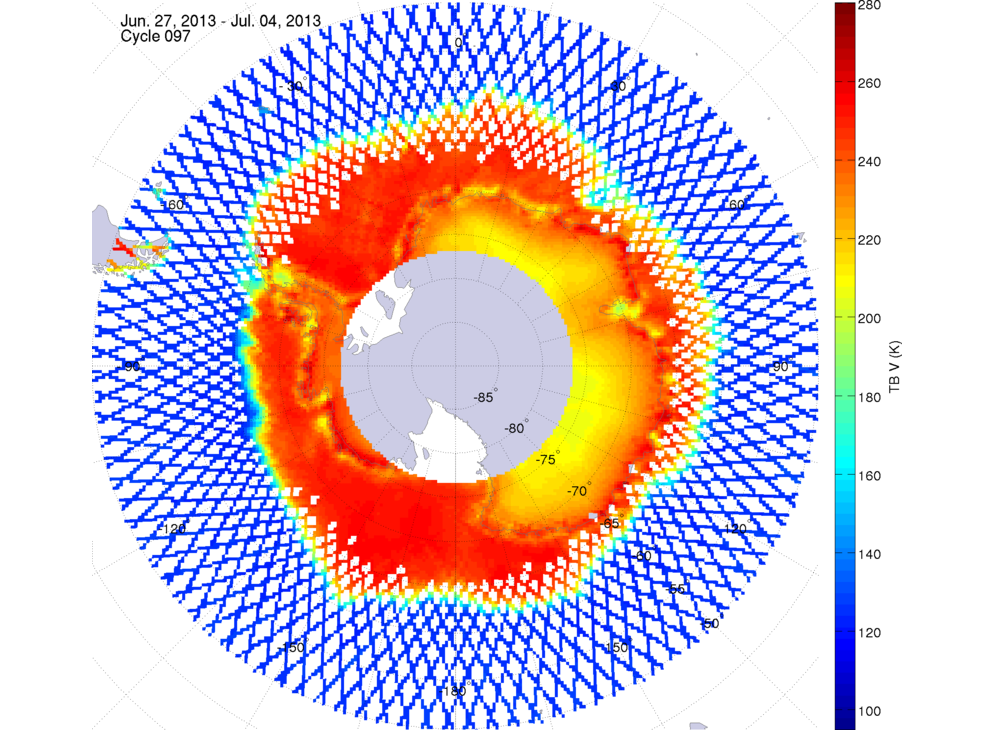 June 27, 2013 | 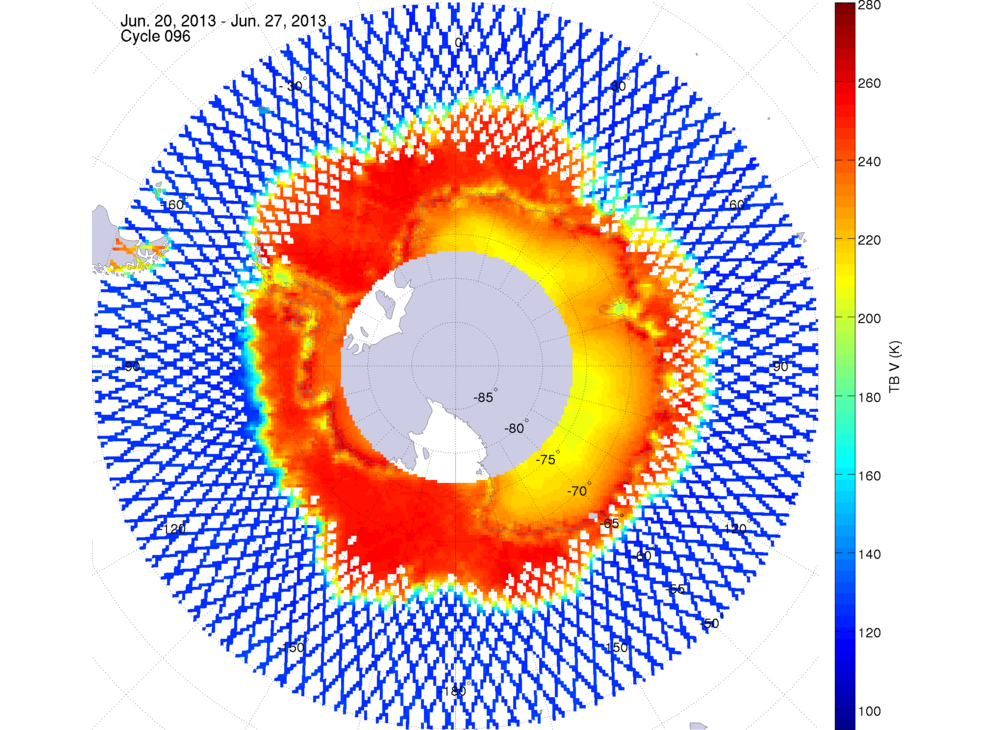 June 20, 2013 | |||
 June 13, 2013 |  June 6, 2013 |  May 30, 2013 | 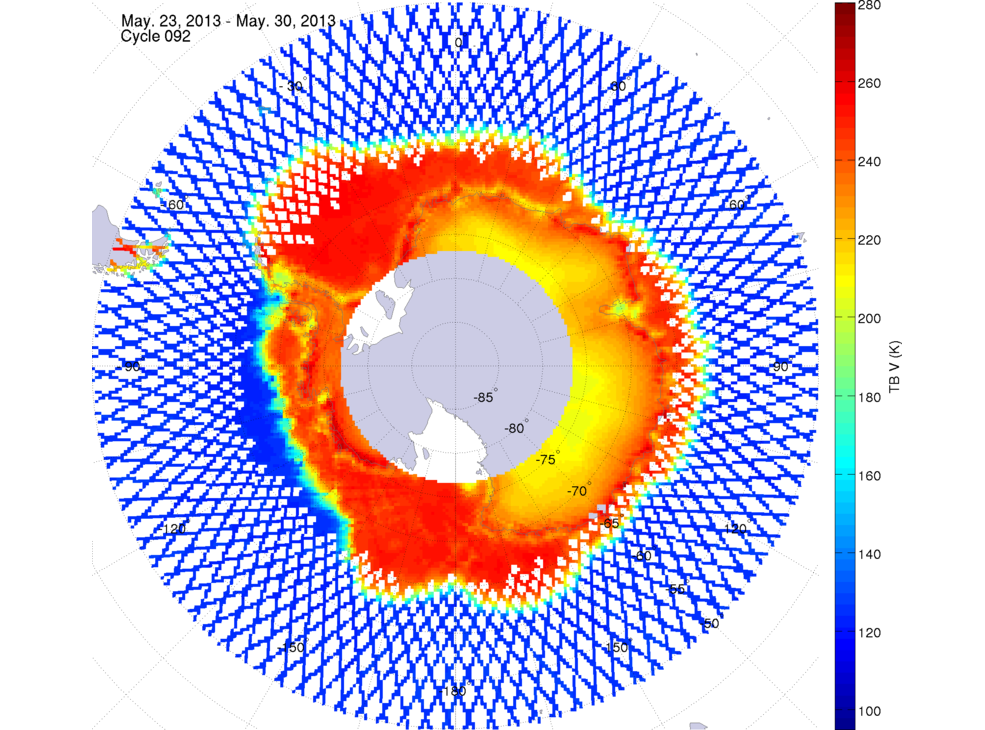 May 23, 2013 | |||
 May 16, 2013 | 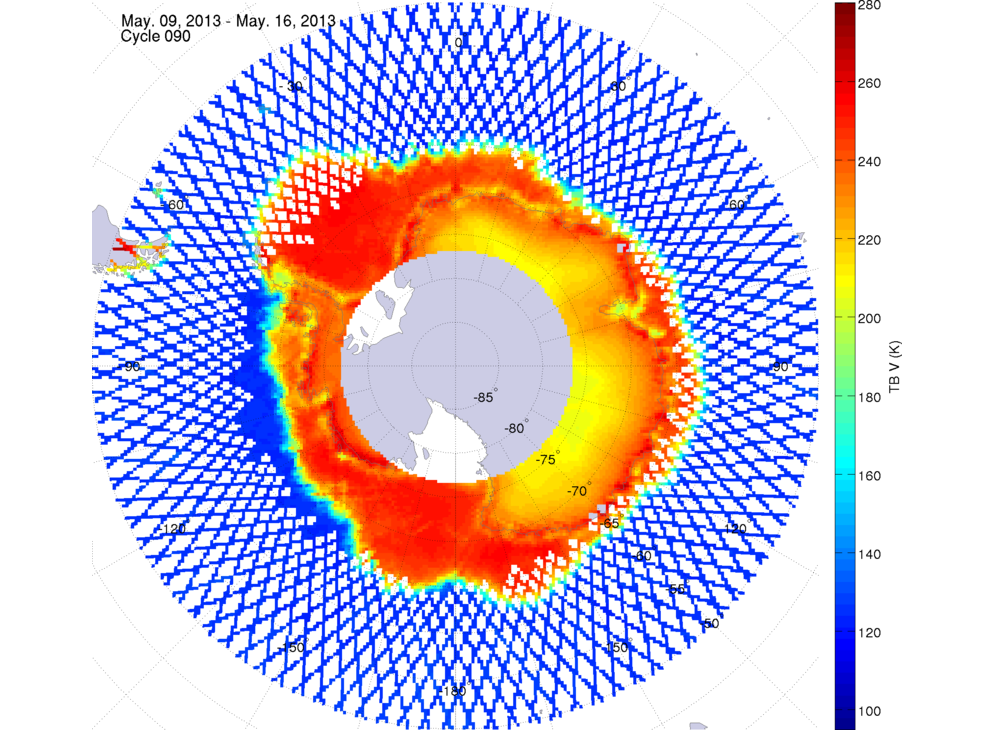 May 9, 2013 | 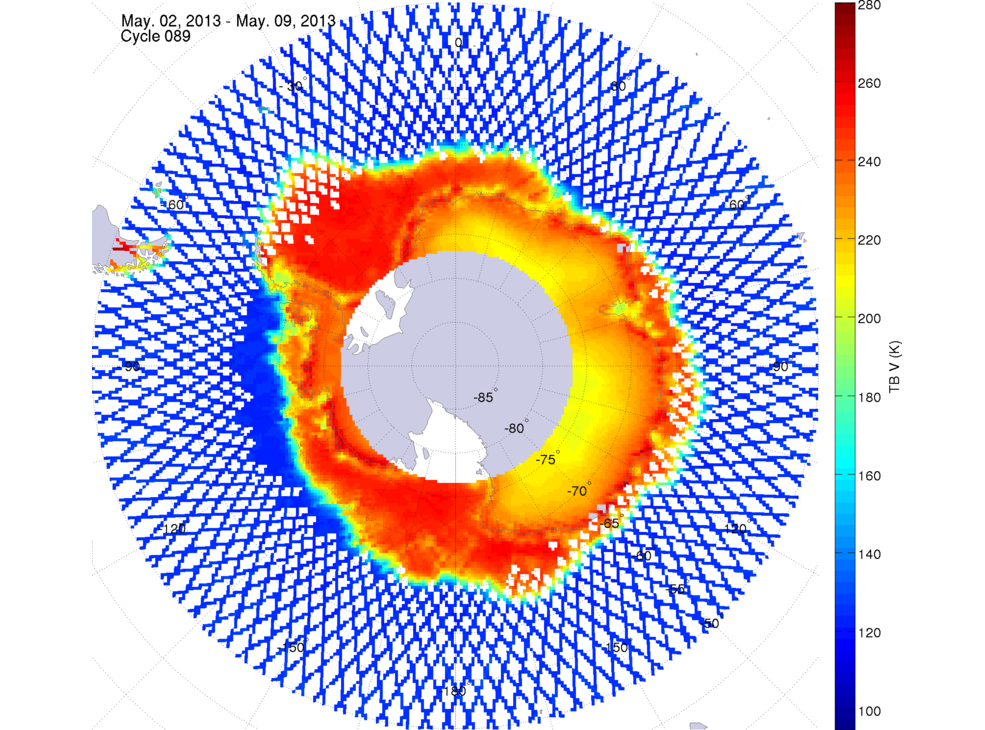 May 2, 2013 | 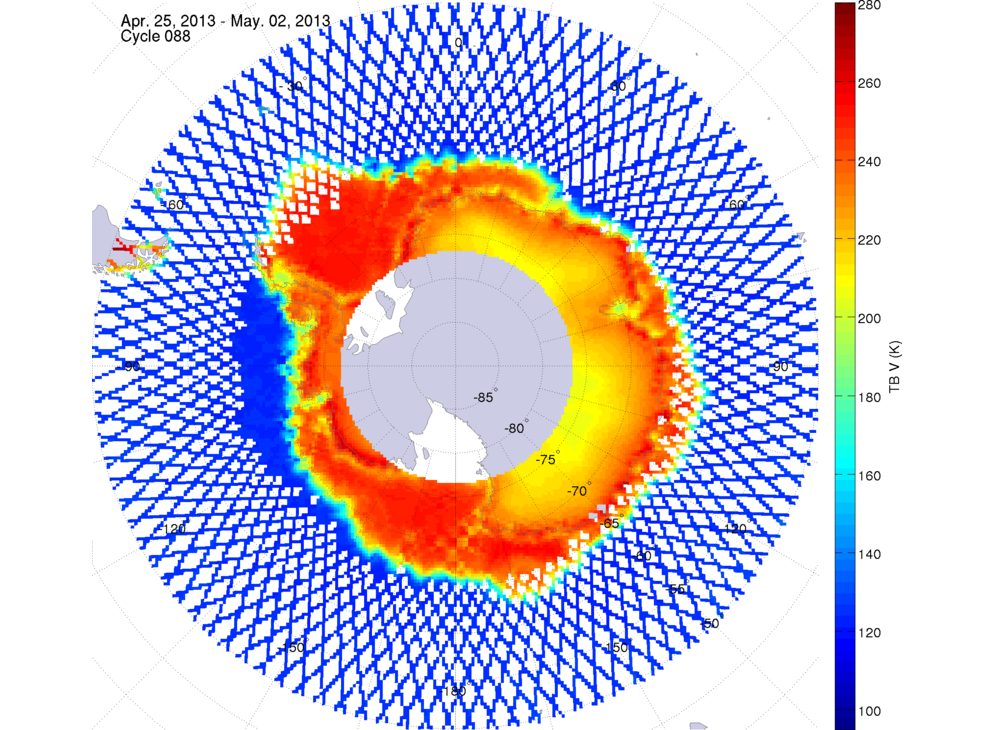 April 25, 2013 | |||
 April 18, 2013 | 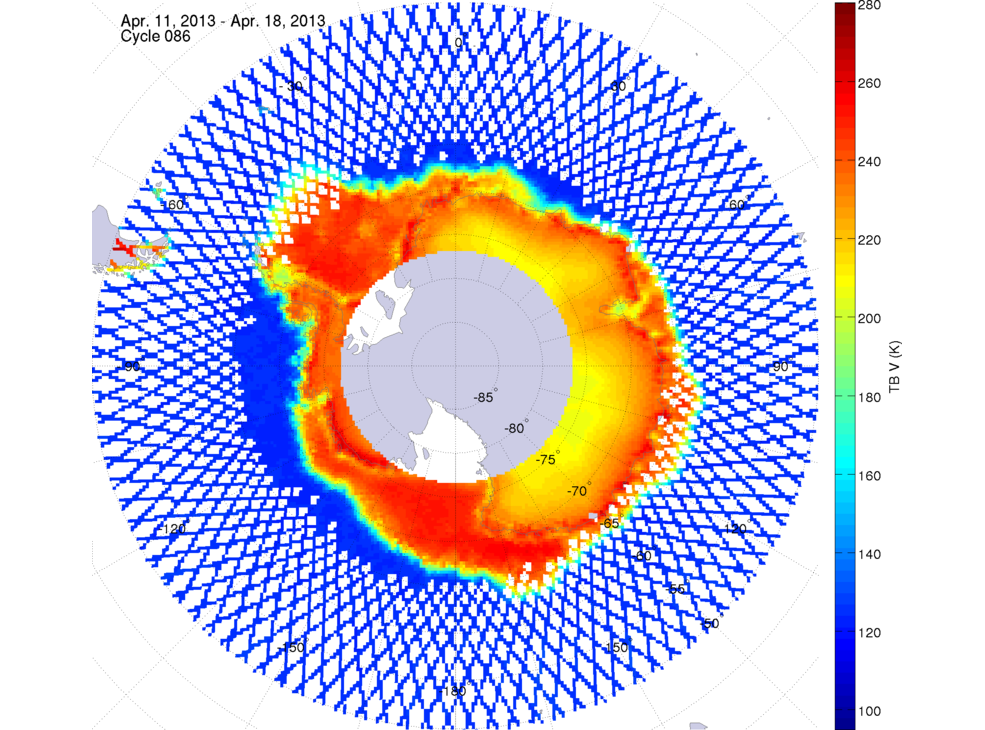 April 11, 2013 | 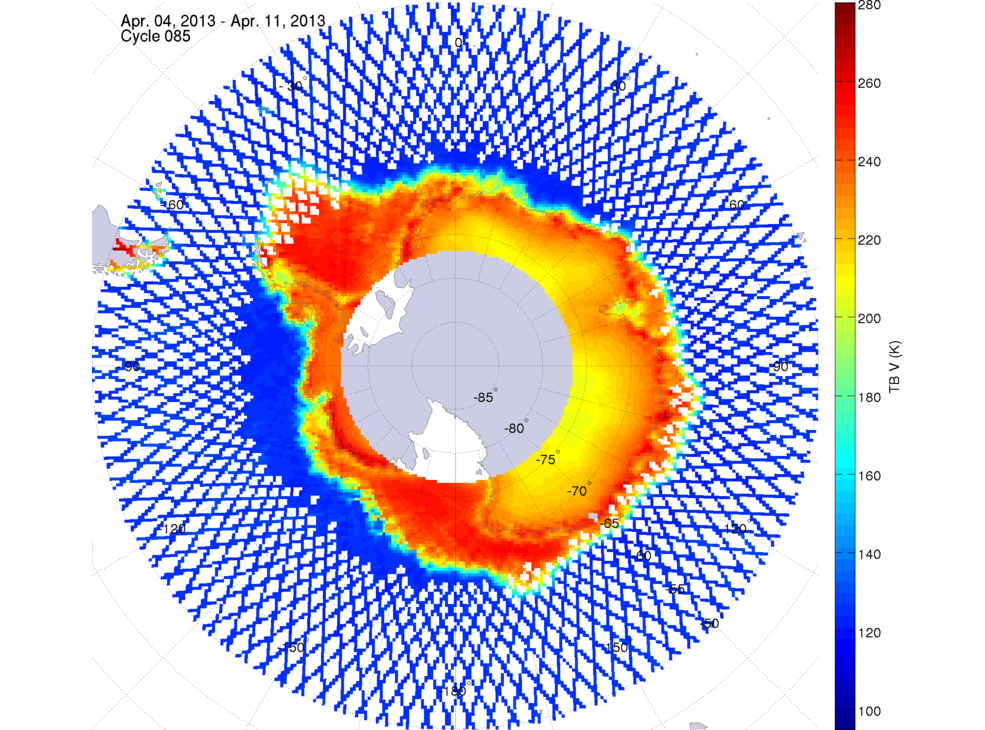 April 4, 2013 | 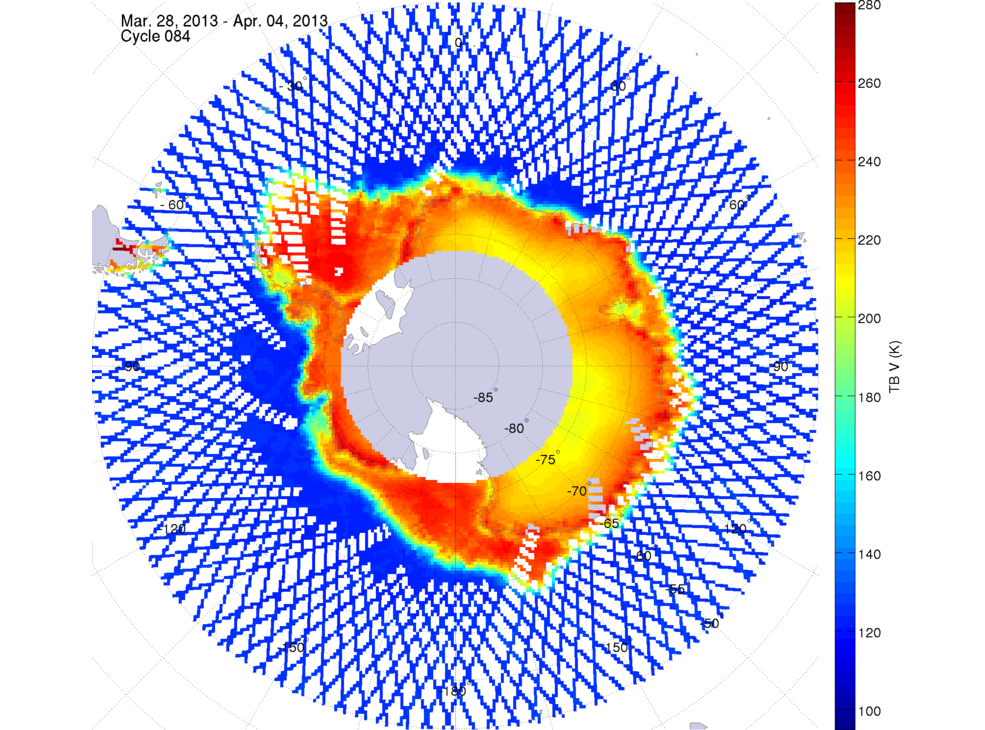 March 28, 2013 | |||
 March 21, 2013 | 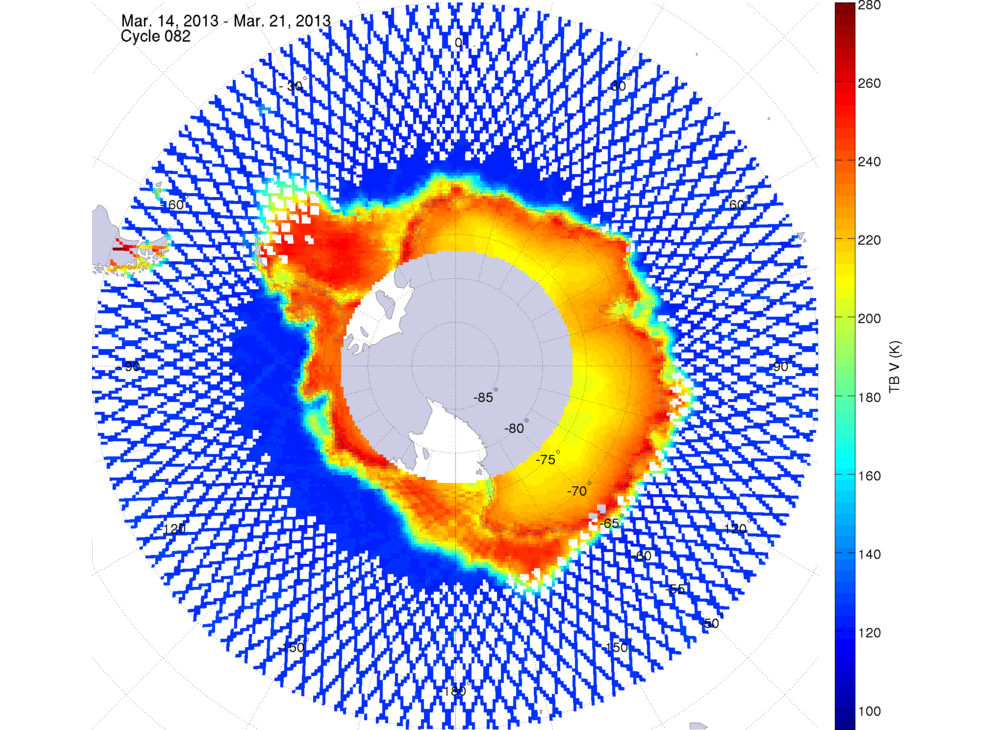 March 14, 2013 | 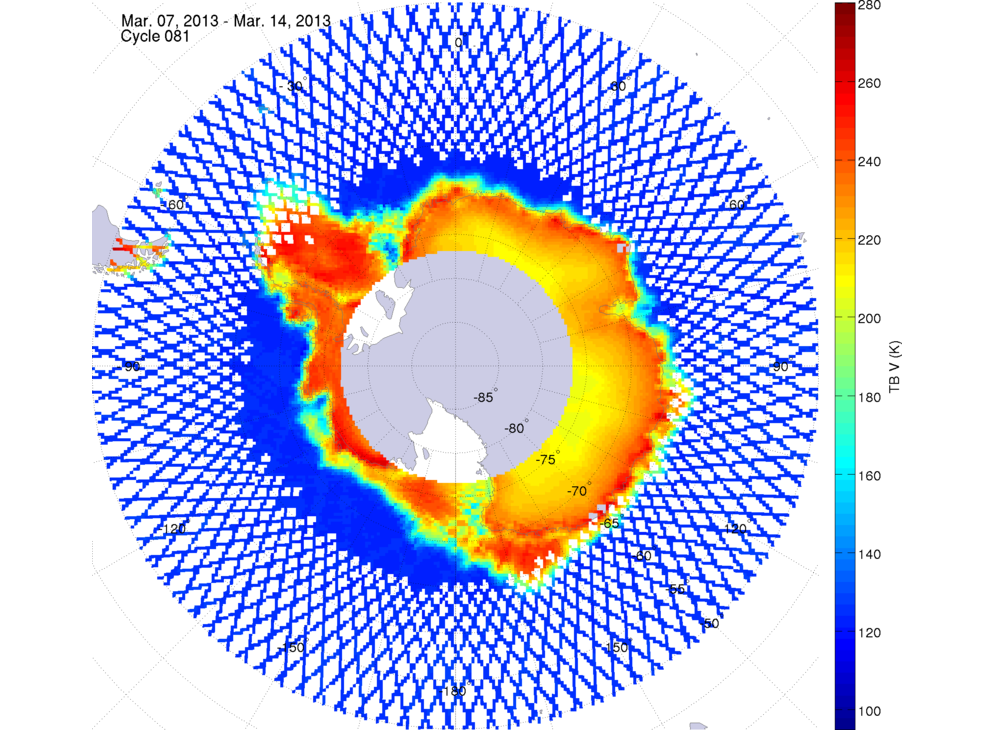 March 7, 2013 | 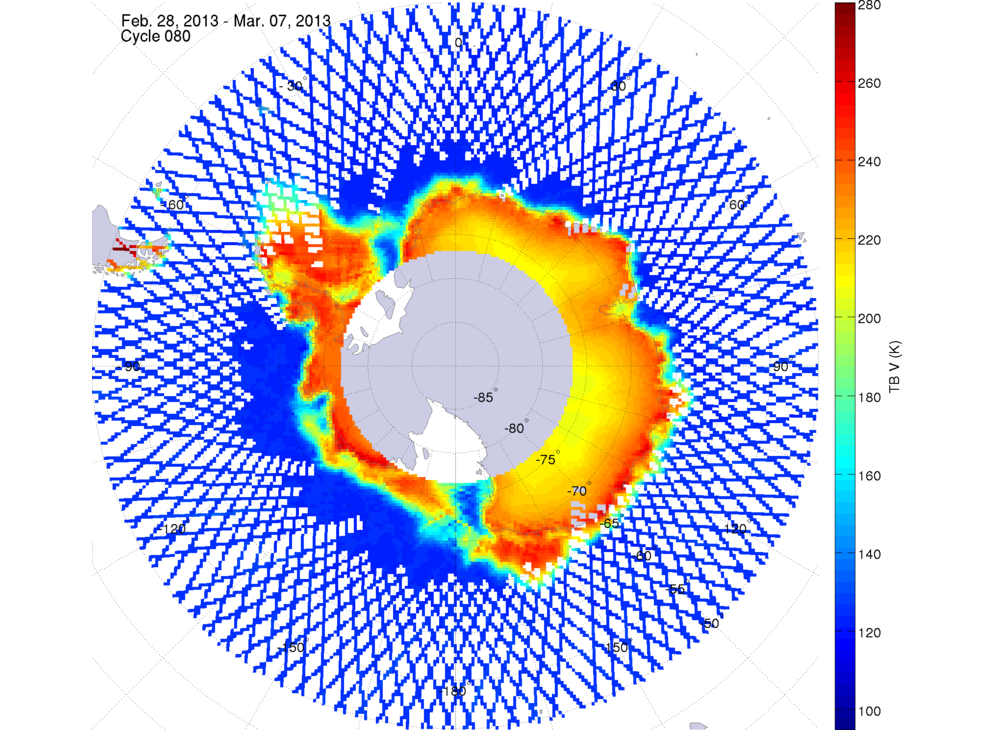 February 28, 2013 | |||
 February 21, 2013 | 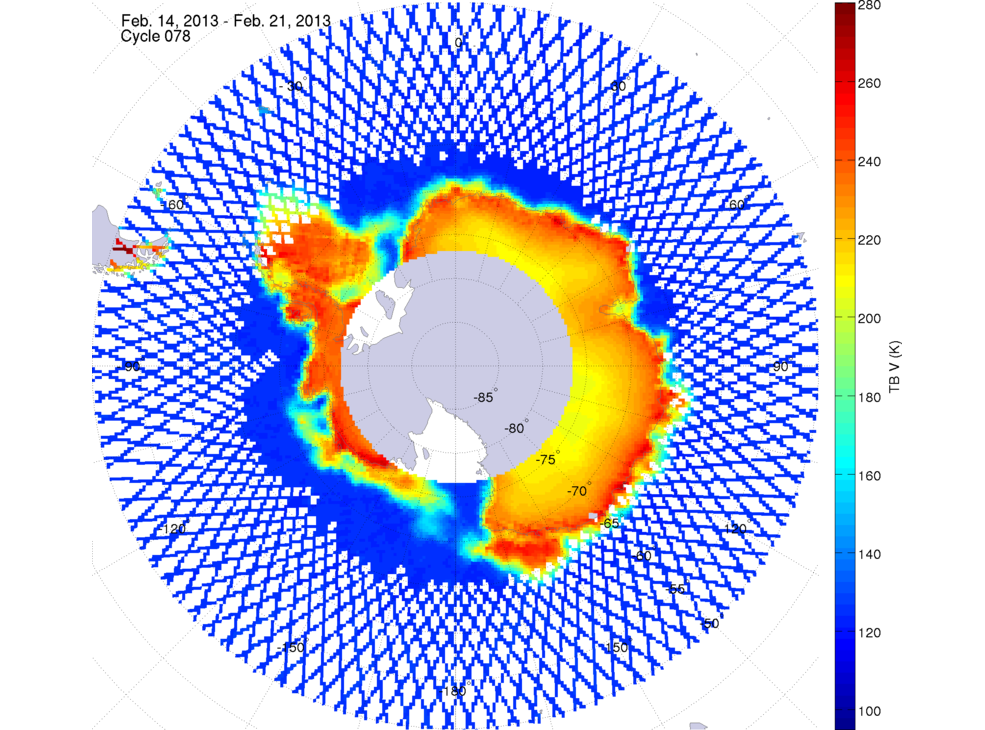 February 14, 2013 | 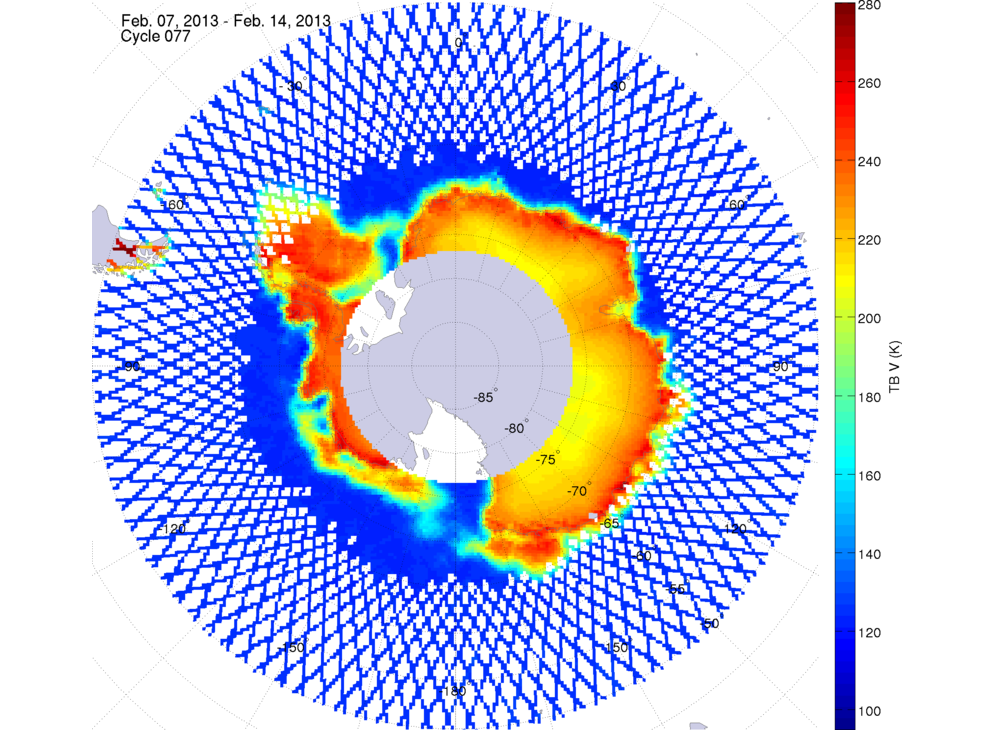 February 7, 2013 |  January 31, 2013 | |||
 January 24, 2013 |  January 17, 2013 | 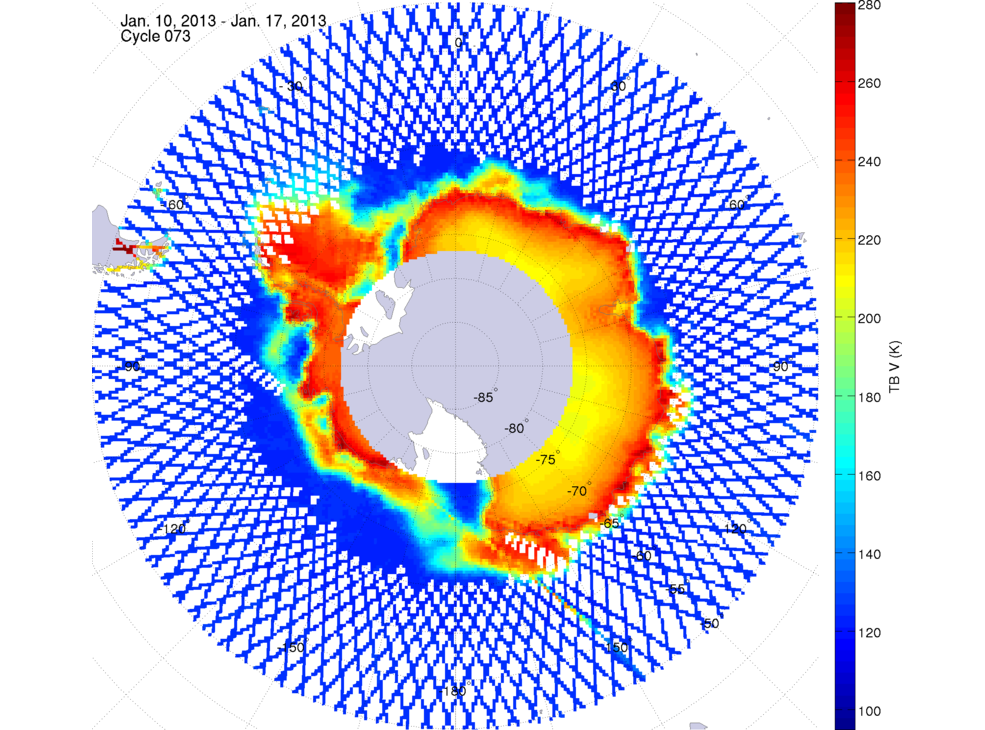 January 10, 2013 | 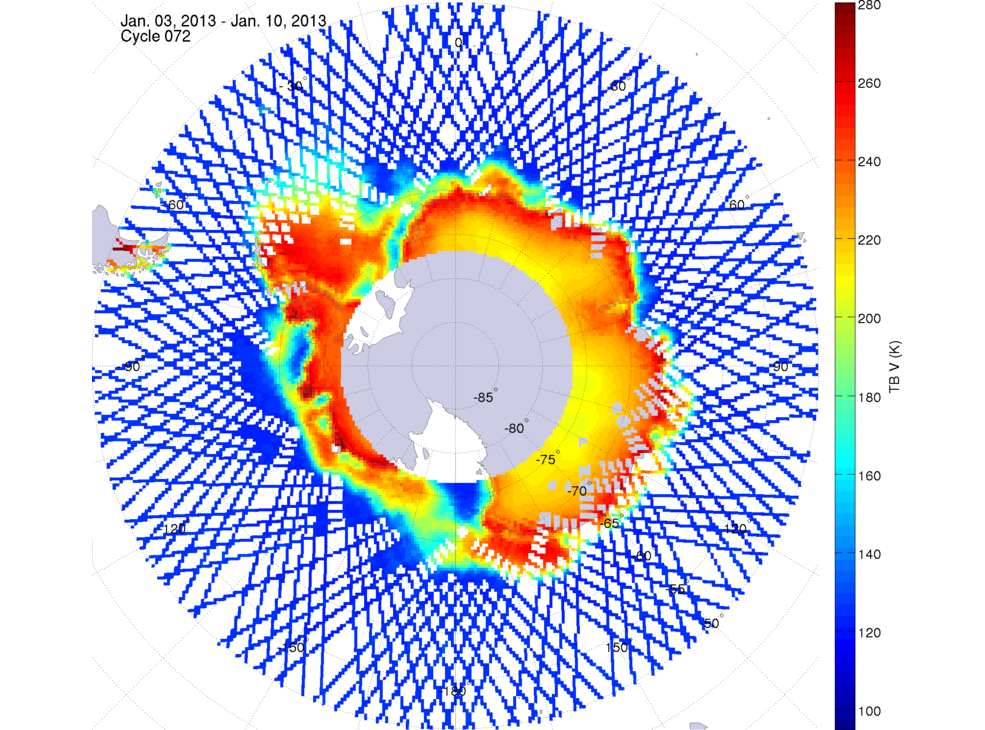 January 3, 2013 | |||
Publications
Brucker, L., Dinnat, E.P., and Koenig, L.S. (2014a). Weekly Gridded Aquarius L-band Radiometer/Scatterometer Observations and Salinity Retrievals Over the Polar Regions - Part 1: Product Description, The Cryosphere, 8, 905-913, doi:10.5194/tc-8-905-2014. Brucker, L., Dinnat, E.P., and Koenig, L.S. (2014b). Weekly Gridded Aquarius L-band Radiometer/Scatterometer Observations and Salinity Retrievals Over the Polar Regions - Part 2: Initial Product Analysis, The Cryosphere, 8, 915-930, doi:10.5194/tc-8-915-2014.
Brucker, L., Dinnat, E.P., Picard, G., and Champollion, N. (2014c). Effect of Snow Surface Metamorphism on Aquarius L-Band Radiometer Observations at Dome C, Antarctica, IEEE Transactions on Geoscience and Remote Sensing, 52 (11), 1-10, doi: 10.1109/TGRS.2014.2312102.