Education: Constructing Explanations and Designing Solutions
|
|
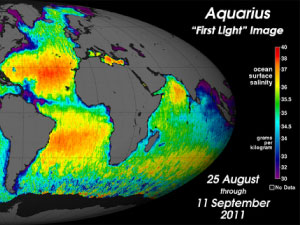
Aquarius First Light Data (00:05:47)
In this clip, Dr. Gary Lagerloef discusses how scientists were able to use Aquarius data to observe major freshwater events in the Amazon River outflow and the Bay of Bengal.
Atmosphere and the Ocean (00:02:26)
Ted Taylor, a high school earth sciences teacher at Bangor High School, discusses how to get more ocean science topics into the classroom.
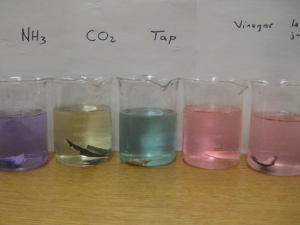
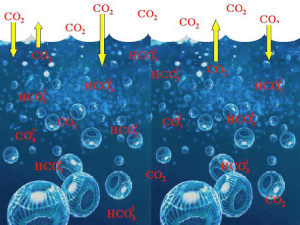
Connecting Topics with Ocean Acidification (00:05:25)
Ted Taylor, an earth science teacher at Bangor High School, has his students work through a series of laboratory activities centered around ocean acidification.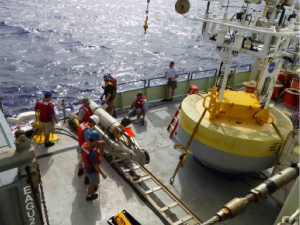
Constructing a Surface Mooring (00:07:18)
Dr. Tom Farrar dicusses how scientists design surface moorings to stay in one place in the middle of the ocean while simultaneously collecting data for up to one year at a time.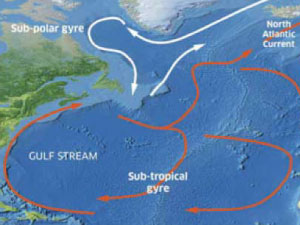
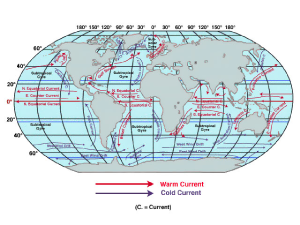
Earth's Rotation Influences Ocean Currents (00:07:31)
In this clip, Julius Busecke discusses how the interactions between atmospheric circulation and the rotation of the earth interact to produce large scale gyres in the North Atlantic Ocean.
How are Humans Affecting Ocean Salinity? (00:07:00)
Dr. Gary Lagerloef explains how understanding ocean salinity can help us to better understand human-induced global climate change.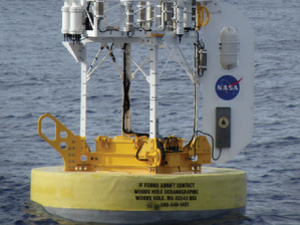
How Do We Define Salinity? (00:01:30)
Dr. Tom Farrar explains what scientists mean when they talk about ocean salinity and defines the associated values.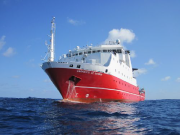
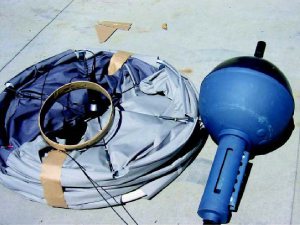
Introduction to a Glider System (00:03:14)
Dr. Fred Bingham introduces viewers to an at-sea glider system, including their importance and function in modern oceanographic research.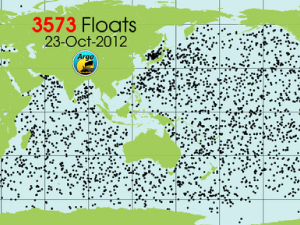
Introduction to Argo (00:03:46)
An introduction to the Argo float program, a worldwide network of profiling floats taking measurements in the world's oceans.
Introduction to Lagrangian Floats (00:03:02)
Dr. Fred Bingham describes how a new type of float - called a Lagrangian float - is used for at-sea salinty research.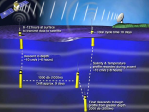
Introduction to the Argo Float Program (00:06:09)
Dr. Stephen Riser explains what an Argo float is and how it has increased scientists' knowledge of global ocean salinity since its implementation.
Introduction to the Prawler Mooring (00:03:04)
Dr. Fred Bingham introduces a specific type of instrument that "crawls" up and down a mooring line. The importance of this new technology, as well as what can happen if things go wrong, are discussed in this clip. 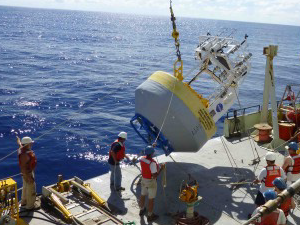
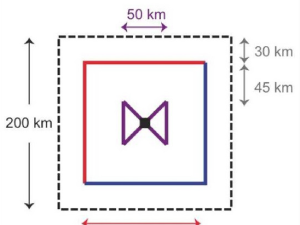
Introduction to the SPURS Moorings (00:05:26)
During SPURS, three research moorings were deployed. In combination, these three stationary platforms collected data in the SPURS region, an area in the northern mid-Atlantic, playing a key role in understanding the high salinity area.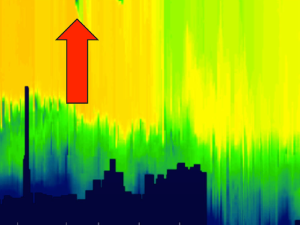
Lagrangian Float Data Visualization (00:02:24)
In this clip, data from a Lagrangian Float - as well as its interpretation - are shared.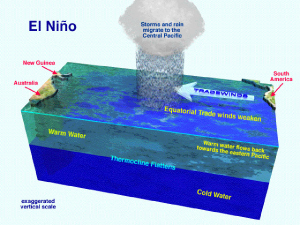
Natural Variability In Ocean Salinity (00:02:53)
Using the El Niño event that occurs off the west coast of South America, Dr. Gary Lagerloef explains what natural salinity variability in the ocean looks like.
Surface Drifters and SPURS (00:04:24)
As part of the SPURS study, 40 surface drifters were deployed to measure salinity and other variables. Dr. Fred Bingham explains their ability to move through the ocean autonomously, and what information that they can provide researchers.
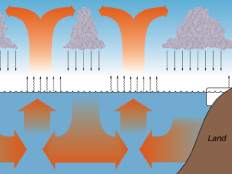
The Water Cycle (00:03:18)
In this clip, Dr. Raymond Schmitt talks about how varying ocean temperatures play a role in the global water cycle.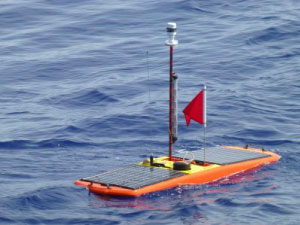
What Are Wave Gliders? (00:03:43)
In this clip, Dr. Fred Bingham gives an overview of the various components aboard a wave glider.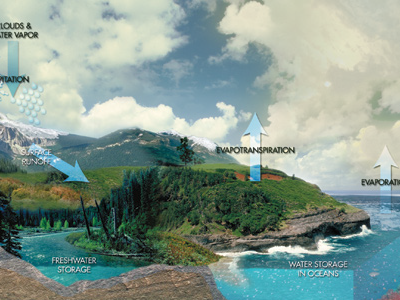
Why Care About Ocean Salinity? (00:04:37)
In this clip, Dr. Stephen Riser explains that ocean salinity is a way to better understand the global water cycle. Salinity plays a role in determining seawater density, which can determine where water travels throughout the oceans.