Education: Analyzing and Interpreting Data
|
|
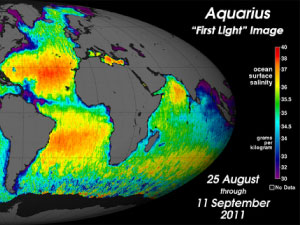
Aquarius First Light Data (00:05:47)
In this clip, Dr. Gary Lagerloef discusses how scientists were able to use Aquarius data to observe major freshwater events in the Amazon River outflow and the Bay of Bengal.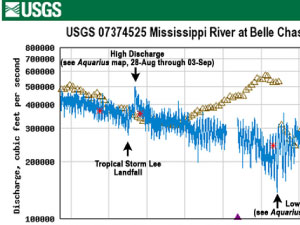
Aquarius Sees the Gulf of Mexico (00:02:48)
Dr. Gary Lagerloef uses data collected from NASA's Aquarius satellite to show ocean processes taking place in the Gulf of Mexico (September, 2011).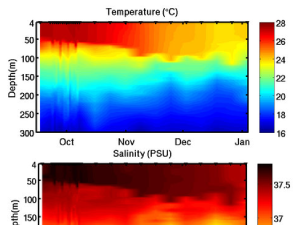
Argo Data Visualization (00:02:33)
Argo floats measure salinity at pre-programmed depths on a regular schedule, sending data back to oceanographers to view. Dr. Fred Bingham walks us through what that data might look like when visualized from month to month and this gives us an idea of how salinity varies throughout the year.
Atmosphere and the Ocean (00:02:26)
Ted Taylor, a high school earth sciences teacher at Bangor High School, discusses how to get more ocean science topics into the classroom.
Engineering Advanced Argo Floats (00:04:41)
In order to better compare Aquarius satellite data (measuring global ocean salinity) to autonomous float data, the scientists involved with the Argo program engineered an "Advanced Argo Float".
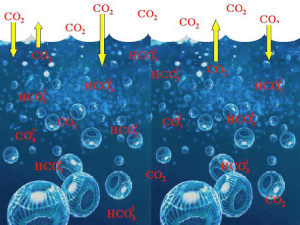
How are Humans Affecting Ocean Salinity? (00:07:00)
Dr. Gary Lagerloef explains how understanding ocean salinity can help us to better understand human-induced global climate change.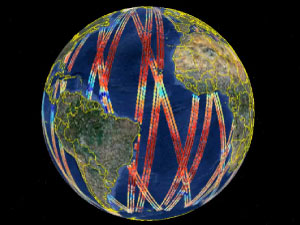
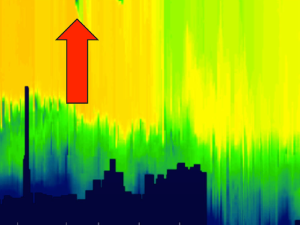
How Do Scientists Visualize Ocean Salinity? (00:03:57)
Simply gathering oceanographic data is not enough: scientists must then translate that data into something they can see and interpret. Learn how by watching this video!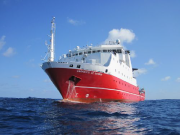
Lagrangian Float Data Visualization (00:02:24)
In this clip, data from a Lagrangian Float - as well as its interpretation - are shared.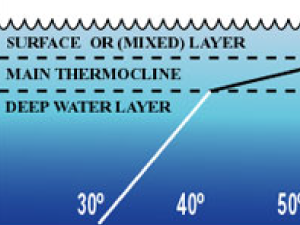
Mixed Layers In the Ocean (00:04:15)
In this video, Julius Busecke, currently a Ph.D student at the Lamont Doherty Earth Observatory, explains what a pycnocline is and why it is an important part of the mixed layer in the ocean. 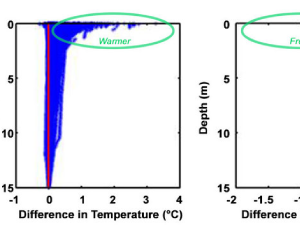
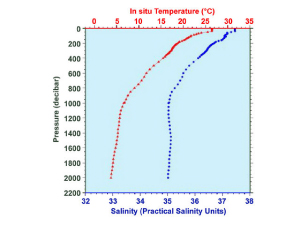
Ocean Salinity Differences: Surface vs. Deep (00:03:45)
Learn how (and why) sea surface temperature and salinity might be varying at the SPURS site in the Atlantic Ocean.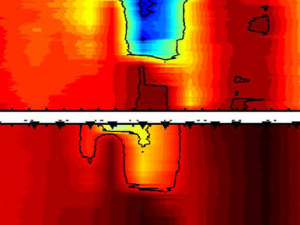
Remote Sensing in the 2000s (00:08:15)
Drs. David Le Vine and Gary Lagerloef explain how remote sensing has evolved throughout the past few decades, focusing specifically on ocean salinity research in the 2000s.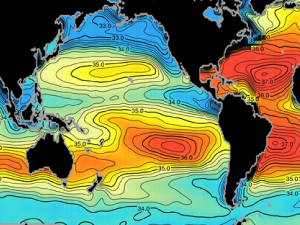
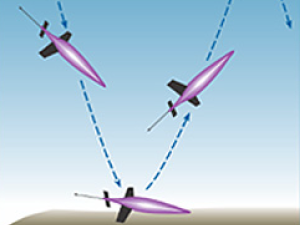
Seaglider Data Visualization (00:03:42)
This clip highlights the mechanisms by which a seaglider, a popular type of oceanographic research equipment, moves throughout the ocean and how it is able to collect and transmit data to satellites in space.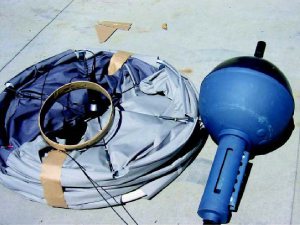
Surface Drifters and SPURS (00:04:24)
As part of the SPURS study, 40 surface drifters were deployed to measure salinity and other variables. Dr. Fred Bingham explains their ability to move through the ocean autonomously, and what information that they can provide researchers.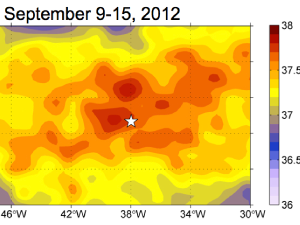
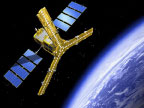
The Aquarius Satellite and SPURS (00:02:50)
Dr. Fred Bingham talks how using both satellites and in-situ equipment is creating a more accurate picture of processes occurring in the salty Atlantic.
The Evolution of Open Ocean Exploration (00:03:14)
Dr. Eric Lindstrom talks about the connection between ocean-going vessels and ocean-observing satellites and how both are vital in learning more about how ocean circulation works and affects our planet.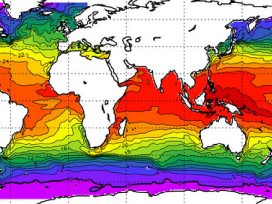
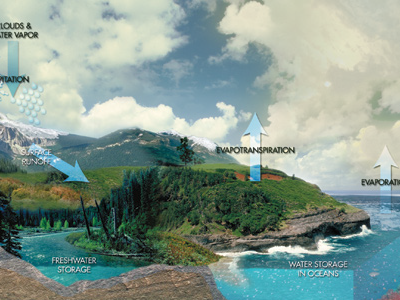
The Water Cycle (00:03:18)
In this clip, Dr. Raymond Schmitt talks about how varying ocean temperatures play a role in the global water cycle.
What Are Ocean Deserts? (00:04:42)
Just like the land, the ocean has areas of high evaporation, little rainfall, and little life - and they are the ocean's "deserts". One such area contains the Atlantic ocean's salinity maximum, where the SPURS cruise took place.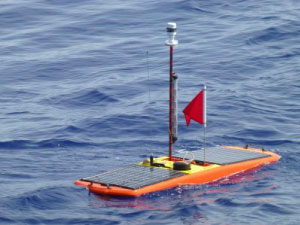
What Are Wave Gliders? (00:03:43)
In this clip, Dr. Fred Bingham gives an overview of the various components aboard a wave glider.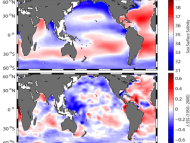
What Can We Learn From Argo Floats? (00:09:44)
Observing changes in global ocean salinity and identifying trends involves the work of many scientists to process multiple types of data.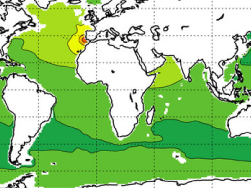
What Does Salinity Look Like? (00:05:12)
Dr. Stephen Riser explains that sea surface salinity can vary not only throughout the global ocean, but also from surface to deep.